I love experiments where the insight-to-time-taken ratio is high. This one pertains to exploring the coordination chemistry of the transition metal region of the periodic table; specifically the tetra-coordination of the series headed by Mn-Ni. Is the geometry tetrahedral, square planar, or other? One can get a statistical answer in about ten minutes.
Mn, (Tc), Re
Fe, Ru, Os
Co, Rh, Ir
Ni, Pd, Pt
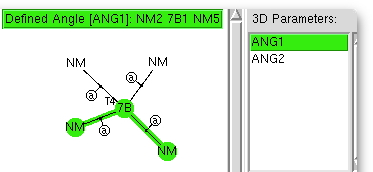
Square planar coordination will manifest with pairs of angles of either 90° or 180°, whilst tetrahedral coordination will reveal only 109°.
This quick survey can be followed up by more detailed explorations of the clusters. For example, can one go to the literature and find out the typical spin state for e.g. the Ni series in each of the geometries. Unfortunately, the CCDC database does not record what the spin state of any individual compound is; one will have to go to the original literature to find out. What a shame that the linkage between two quite different properties is (as far as I know) not available in any easily searchable form. Alternatively, one can narrow down the searches to individual searches of row 1, 2 or 3 of the transition series and then compare the behaviour. The possibilities are considerable.
Then there are the outliers in each plot. Some (many?) may prove to be due to faulty data (whilst we have specified no errors, they can still occur) but others may be due to an unusual structural feature, or perhaps even an as yet unrecognized phenomenon! Set as a student experiment, one might ask each student to explore say 3 outliers and express an opinion as to what causes them to deviate. Enjoy!
This post has been cross-posted in PDF format at Authorea.
In the mid to late 1990s as the Web developed, it was becoming more obvious…
I have written a few times about the so-called "anomeric effect", which relates to stereoelectronic…
The recent release of the DataCite Data Citation corpus, which has the stated aim of…
Following on from my template exploration of the Wilkinson hydrogenation catalyst, I now repeat this…
In the late 1980s, as I recollected here the equipment needed for real time molecular…
On 24th January 1984, the Macintosh computer was released, as all the media are informing…