In a previous post, I set out how to show how one can reduce a 1H NMR spectrum to the structure [A] below. I speculated how a further test could be applied to this structure; back predicting its spectrum using just quantum mechanics. Overkill I know, but how well might the two match?
- The process must start by considering the conformational possibilities of [A]. Each will have a different predicted spectrum. There are six rotatable bonds in the system, which if each bond has up to three rotamers would be 729 conformations potentially possible. A nightmare to explore (but do-able if you really needed to). I will try to reduce this by searching for the most probable for each bond (which may not of course lead to the final best conformation).
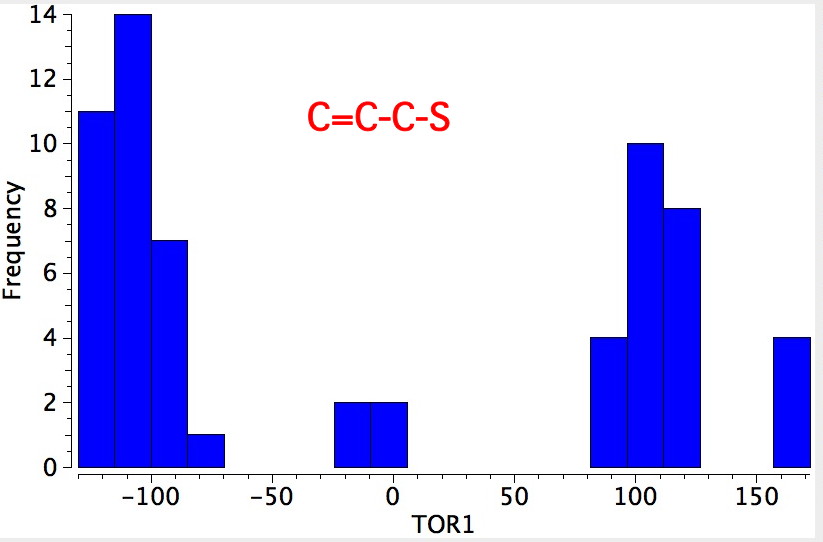
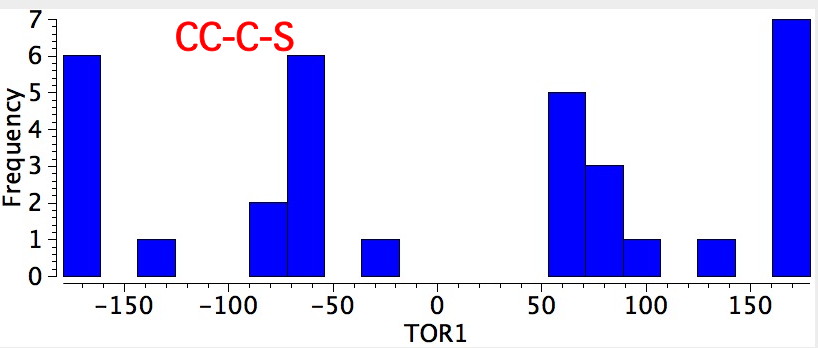
- Bonds 1 and 2 can be subjected to a search of the Cambridge database. The search criteria are the same as described in this post. The most probable dihedral angle around this type of bond is ± 110°.
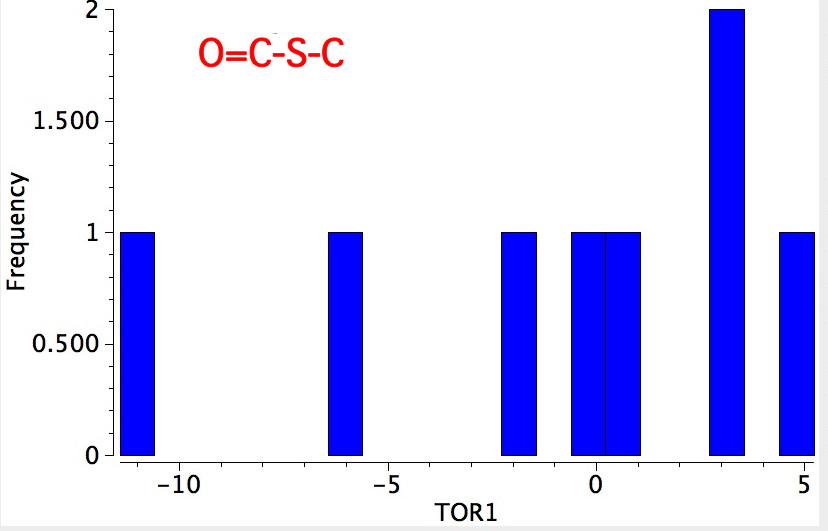
- Bond 3 has few entries, but they show as:
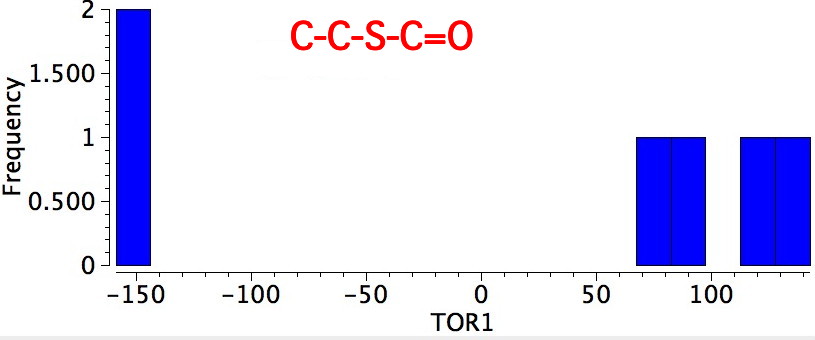
- Bonds 4/5 are also the one that controls the conformation of esters, and is known as S-cis. All examples show the lone pair on the sulfur as anti to the axis of the C=O bond.
- Bond 6 has just two conformations, anti and gauche.
- We have reduced the possible 729 to just two, which are then subjected to a ωB97XD/6-311G(d,p)/SCRF=chloroform calculation. Some faith in this combination can be obtained by inspecting the (remarkably accurate) result obtained for a Matryoshka doll. A suitable model can be invoked using a keyword NMR(mixed.spinspin). The method recovers at least a proportion of the effects on conformation induced by the weak dispersion forces present. The prediction comes in two forms:
- The magnetic shieldings relative to TMS (chemical shifts). One might expect these to be predicted with an error of around 0.3ppm, but if the actual NMR population comprises more than one rotamer, then one does need to take the Boltzmann average. For this molecule, predicting how the magnetic anisotropy induced from the double or triple bonds will perturb the chemical shifts will depend critically on the conformation of the molecule. In other words, this is actually a pretty challenging system to get right!
- The spin-spin couplings. These have an expected predictability of ~1 Hz.
- The calculation comes up with essentially identical free energies for the two selected conformations:
- The experimental spectrum was δ 1.70 (3H,d,6Hz), 2.23 (1H, t, 3Hz), 3.73 (2H, d, 3Hz), 4.84 (1H, dd, 7,8Hz), 5.15 (1H, d, 10Hz), 5.27 (1H, d, 17Hz), 5.51 (1H, dd, 8,16.5 Hz), 5.77 (1H, dq, 6,16.5 Hz), 5.88 (1H, ddd, 7,10,17Hz).
- To compare with the computed one, firstly I note that the values for the three hydrogens of the methyl group have to be averaged over both conformations. The predicted chemical shifts are shown below. For the anti conformation, they all come within about 0.3ppm of the measured value.
| – |
Chemical shifts |
|---|
| Proton |
Expt |
anti |
Gauche |
| 1 |
1.70 |
1.68 |
1.66 |
| 2 |
5.77 |
6.15 |
6.17 |
| 3 |
5.51 |
5.76 |
5.76 |
| 4 |
4.84 |
4.66 |
4.76 |
| 5 |
5.88 |
6.15 |
6.19 |
| 6 |
5.15 |
5.59 |
5.58 |
| 6 |
5.27 |
5.76 |
5.84 |
| 11 |
3.73 |
3.40 |
3.01 |
| 11 |
3.73 |
3.49 |
3.01 |
| 13 |
2.23 |
2.19 |
2.05 |
- The spin-spin couplings are shown below. Several differ by about 3Hz, but most are better. Notice how the sign of the coupling from H-11 to H-13 is identified as negative, and how the methylene group at C-11 is identified as slightly diastereotopic (from the presence of the chiral centre). The 2JHH coupling is not detected in the (first order) measured spectrum.
| – |
Couplings, Hz |
|---|
| Proton |
Expt |
anti |
Gauche |
| 1 |
6 |
6.6 |
6.6 |
| 2 |
6,16.5 |
6.6,13.6 |
6.6,13.6 |
| 3 |
16.5,8 |
13.6,9.2 |
13.6,9.2 |
| 4 |
8,7 |
9.2,10.2 |
9.2,10.2 |
| 5 |
7,10,17 |
10.2,10.4,15.4 |
10.210.4,15.4 |
| 6 |
10 |
10.4 |
10.4 |
| 6 |
17 |
15.4 |
15.4 |
| 11 |
±3 |
-15.5,-3.7,-3.7 |
-17.3,-3.5,-3.3 |
| 11 |
±3 |
-3.7,-3.7 |
-3.5 |
| 13 |
±3 |
-3.7, -3.7 |
-3.3 |
We might conclude from this analysis that the match between the measured spectrum of [A] and that calculated entirely from quantum mechanical principles is pretty good. We may be reasonably confident that the conformations we have identified are realistic. Of course, if we want to be sure there is none better, then the few hundred other possible conformations would have to be calculated. I am not about to try!