With metrics in science publishing controversial to say the least, I pondered whether to write about the impact/influence a science-based blog might have (never mind whether it constitutes any measure of esteem). These are all terms that feature large when an (academic) organisation undertakes a survey of its researchers’ effectiveness.‡ WordPress (the organisation that provides the software used for this blog) recently enhanced the stats it offers for its users, and one of these caught my eye.
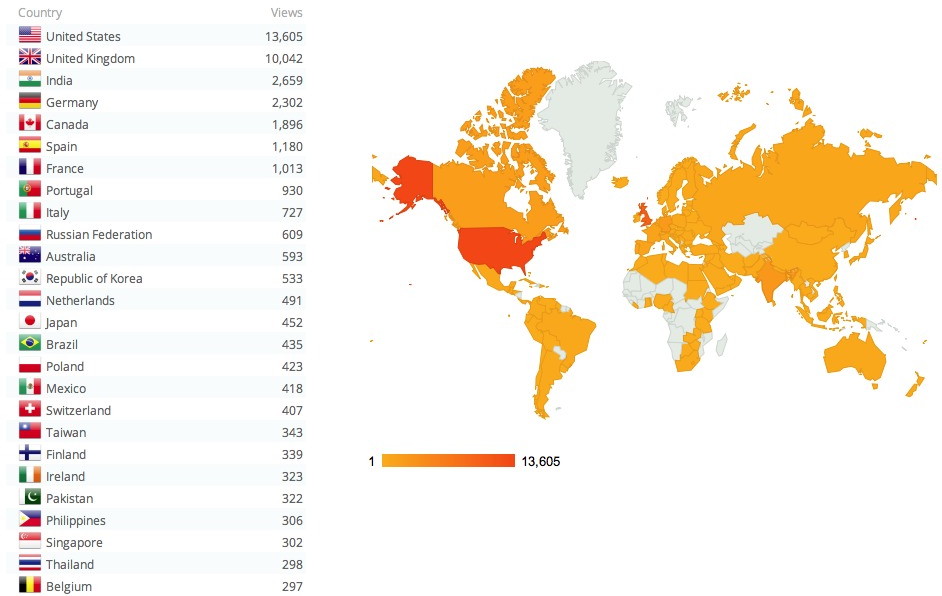
The above represents the demographics for the readership of this blog over the last ten months. In no particular order, I noted the following aspects:
One does not get such statistics from conventional scientific publishers, where the number of citations of an article is considered far more important than the demographics of its readership. However, I cannot help but note that access to journals is largely controlled by paid-for subscriptions (the GOLD-OA model has yet to make a big impact in chemistry I fear), whereas blogs in contrast are almost entirely open (although access to them may be restricted in some countries).
‡ I once listened to a talk by a manager whose mantra was the three e’s: effective, efficient and economic.
In the mid to late 1990s as the Web developed, it was becoming more obvious…
I have written a few times about the so-called "anomeric effect", which relates to stereoelectronic…
The recent release of the DataCite Data Citation corpus, which has the stated aim of…
Following on from my template exploration of the Wilkinson hydrogenation catalyst, I now repeat this…
In the late 1980s, as I recollected here the equipment needed for real time molecular…
On 24th January 1984, the Macintosh computer was released, as all the media are informing…
View Comments
It is nice to see that Africa is not one blank area, and that thus Science 2.0 engagement is growing throught the continent!
Absolutely. However, there is some regret that whenever I cite a "conventional" publication in the blog, it is increasingly the case that many readers may not have access rights to the journal. Even where I work, I find that instant access to older issues of journals is not automatic, and I have to apply for an inter-library-loan to get them. These often arrive as photocopied sheets of paper up to a week later. Roll on when science publishing becomes properly open.
Views per capita:
United Kingdom
Portugal
Finland
Singapure
Canada
Switzerland
Ireland
United States
Netherlands
Germany
Belgium
Australia
Spain
France
Taiwan
Italy
Poland
Republic of Korea
Thailand
Russian Federation
Mexico
Japan
Philippines
Brazil
India
Pakistan