Most of the chemical structure diagrams in this blog originate from Chemdraw, which seems to have been around since the dawn of personal computers! I have tended to use this program to produce JPG bitmaps for the blog, writing them out in 4x magnification, so that they can be scaled down for display whilst retaining some measure of higher resolution if needed for other purposes. These other purposes might be for e.g. the production of e-books (using Calibre), the interesting Blog(e)book format offered as a service by Feedfabrik, or display on mobile tablets where the touch-zoom metaphor to magnify works particularly well. But bitmap images are not really well future proofed for such new uses. Here I explore one solution to this issue.
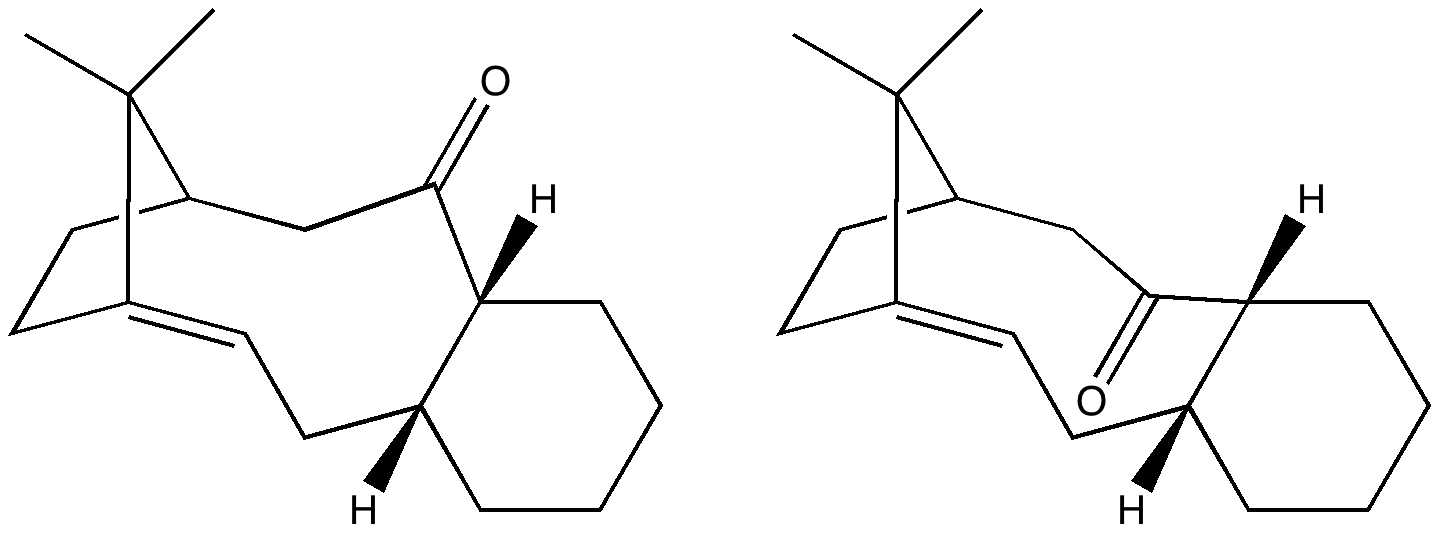
I have previously mentioned scalable vector graphics (SVG) as an alternative, and fortunately the production of such has become routine.3 The diagram above2 is indeed SVG (and if you cannot see it, then try a modern SVG-capable browser1). It was produced thus:
1 I notice that Internet Explorer 9 (both 32- and 64-bit versions) will display (and save) the above diagram if you click on it, but it cannot (yet) be inlined into the post, although the documentation implies it should.
2 The version below is the conventional JPG form (click on it to see the original 4x version).
3. Historical note. Peter Murray-Rust and I have been promoting SVG for use in chemistry for 11+ years now. For one ancient page, see here. The syntax has decayed somewhat, but some of the diagrams still work!
In an earlier post, I discussed a phenomenon known as the "anomeric effect" exhibited by…
In the mid to late 1990s as the Web developed, it was becoming more obvious…
I have written a few times about the so-called "anomeric effect", which relates to stereoelectronic…
The recent release of the DataCite Data Citation corpus, which has the stated aim of…
Following on from my template exploration of the Wilkinson hydrogenation catalyst, I now repeat this…
In the late 1980s, as I recollected here the equipment needed for real time molecular…
View Comments
Sure, let me put together a demo with CML and the ChemDoodle Web Components. I will put it up when I get a chance tonight.
There are two ways to deal with CML, since it is XML. The first is by Javascript string, and we would then need a Javascript XML parser. To get around this, we use a webservice to parse the CML as will be shown in the demo. XHR2 is used so that anyone can call this directly from any website. The second way is via the HTML DOM, if you wanted to embed the CML in an SVG element or somewhere else in the DOM. Currently, the ChemDoodle Web Components doesn't do this, but maybe in the future.
Any clipboard functions, including copy and paste, are forbidden in Javascript, so a simple way to extract the data is not possible. However, using the XHR2 service, we can save the data to a file format of your choice, and then have the user download it. This should also work on Android, but probably not iOS. I will show this in the demo as well.
Here is the demo: http://web.chemdoodle.com/demos/chemical-markup-language-cml