The previous post set out a problem in conformational analysis. Here is my take, which includes an NCI (non-covalent interaction) display as discussed in another post.
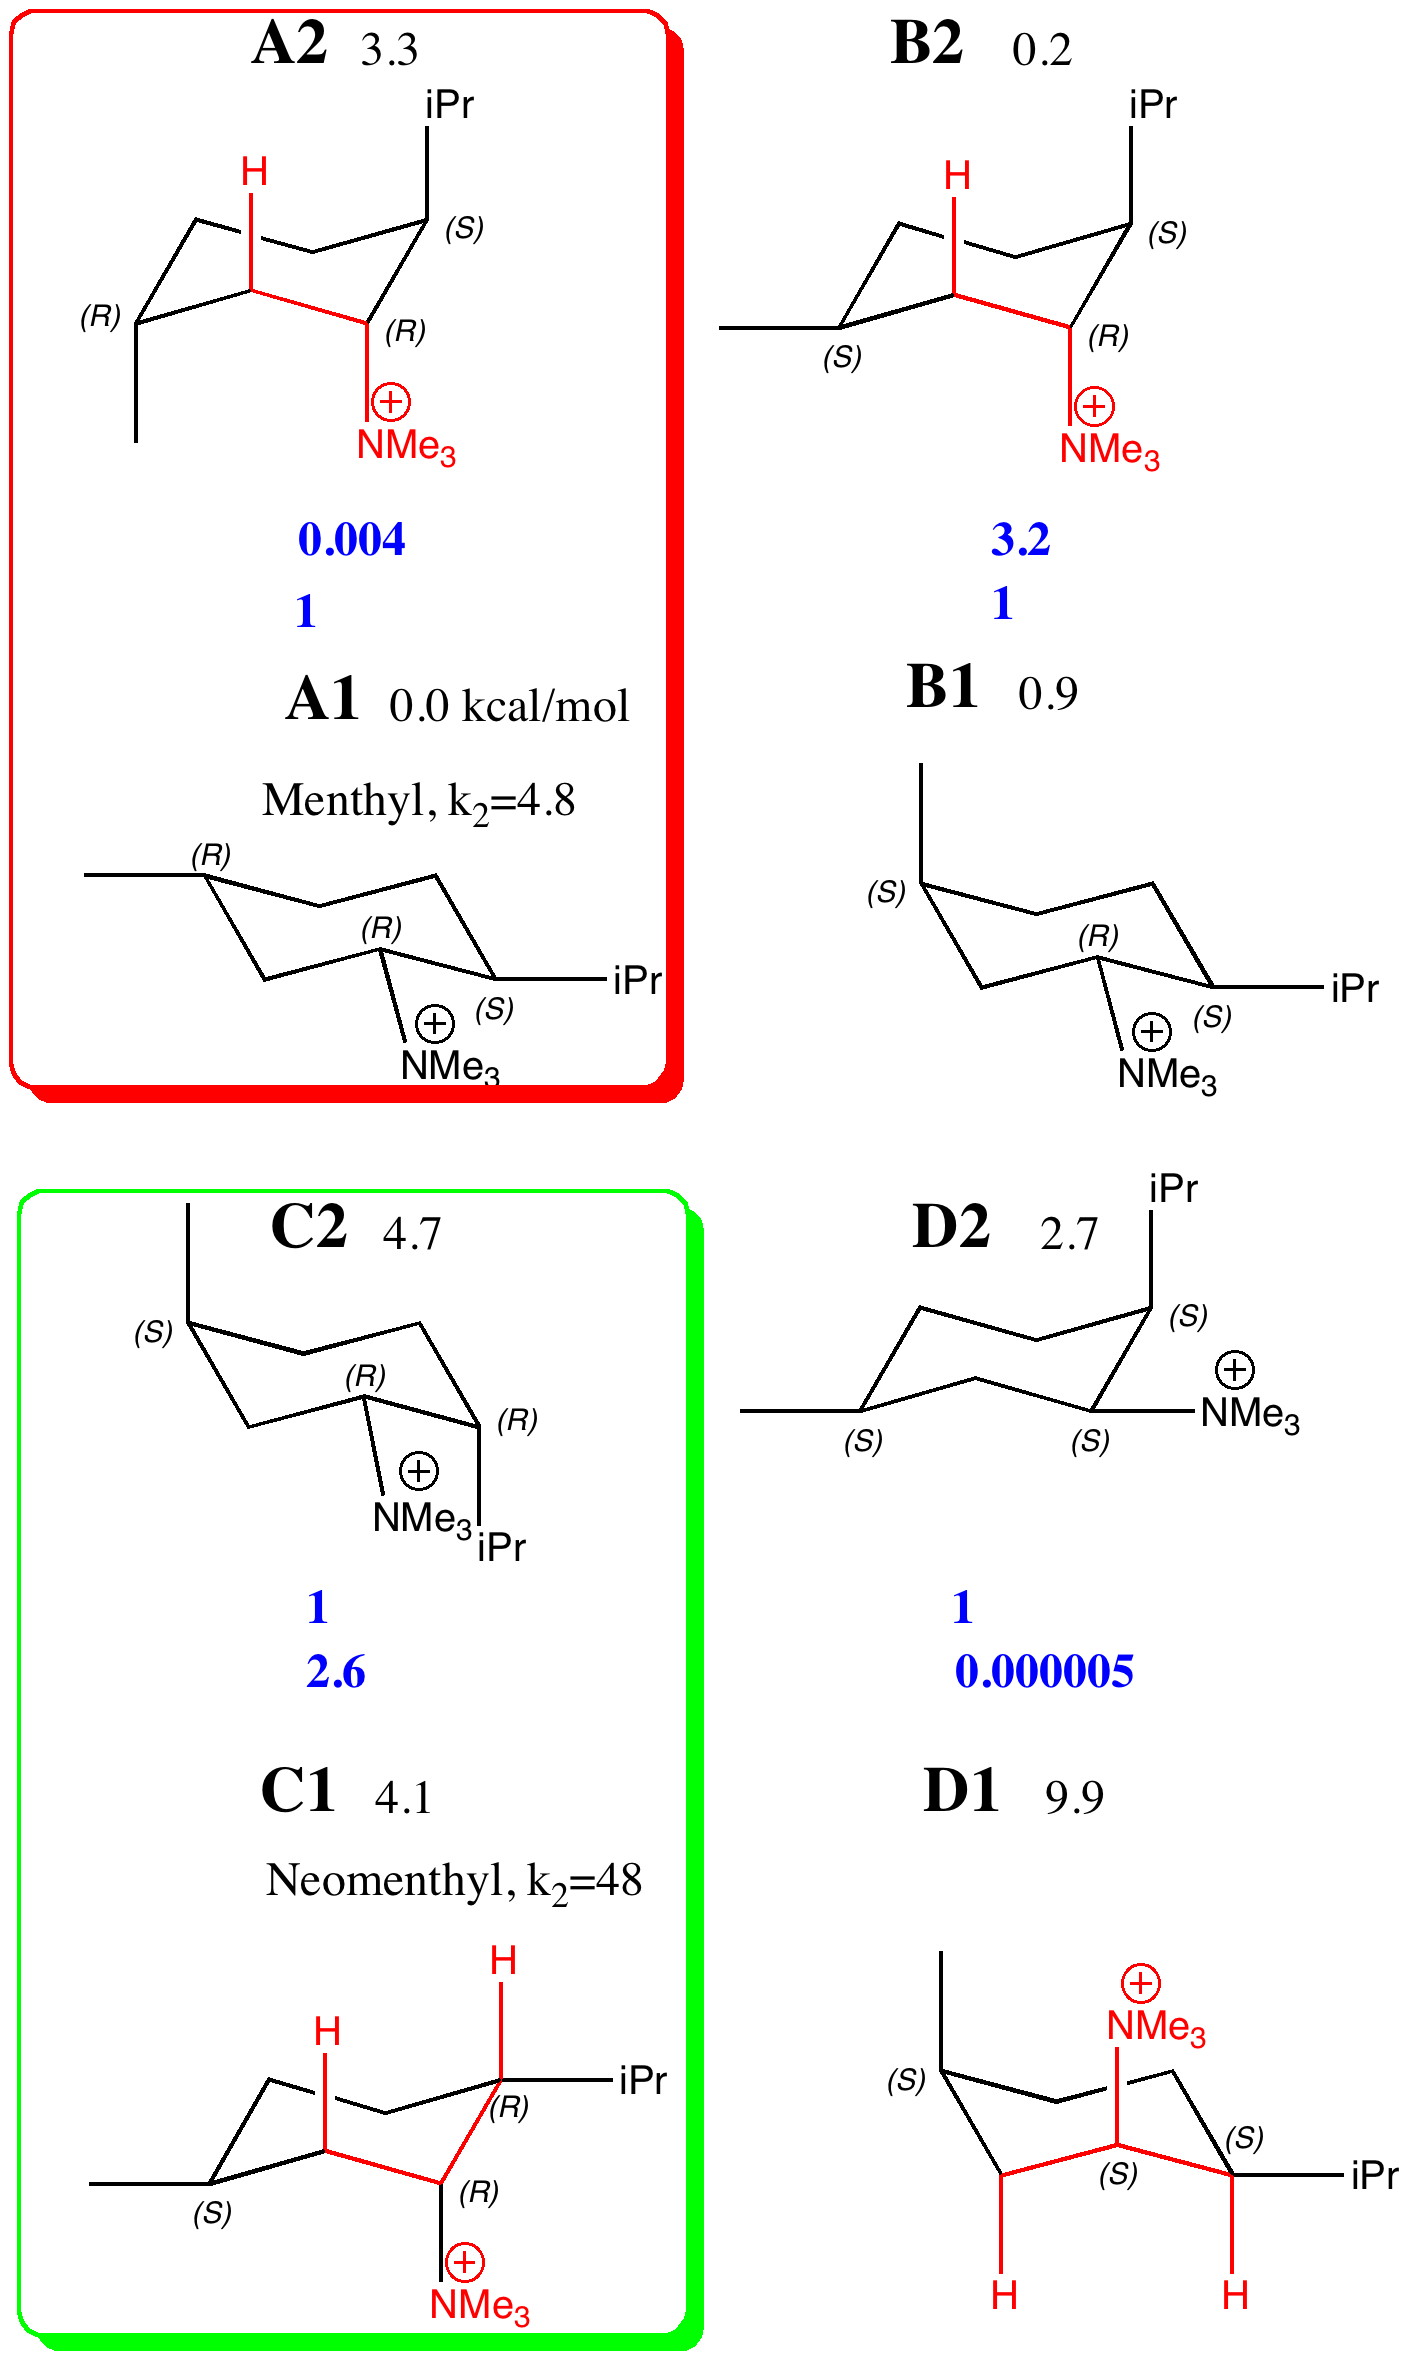
The lowest energies of the four diastereomers A-D, each in two conformations (1/2) were calculated at the ωB97D/6-311G(d,p)/SCRF=ethanol level, and are shown here relative to A1 (kcal/mol) as free energies. The values of ΔΔG of each pair (relative to the lower energy conformation) are converted to relative concentrations using ΔΔG = -RT Ln K and these are shown in blue. Those conformations where a C-H bond is aligned anti-periplanar (app) with the C-NMe3 bond are highlighted in red. Various aspects of the questions posed include:
I thought I would finish by adding an NCI analysis using a wavefunction computed for ωB97D/6-31G(d,p)/SCRF=ethanol. The green surfaces are indicative of regions where non-covalent interactions are occurring (which include electrostatic and van der Waals effects). The colour scheme is set to blue(ish) to indicate more attractive NCIs (such as strong hydrogen bonds), green to indicate weak(ish) NCIs, with a red or orange tinge indicating a repulsive NCI.
A2 diaxial. Click for 3D. |
B2 Axial-equatorial. click for 3D. |
A1. Di-equatorial. Click for 3D. |
B1.Di-equatorial. click for 3D. |
C2. Equatorial-axial. Click for 3D. |
D2. Equatorial-axial. Click for 3D. |
C1 SRR. Axial-equatorial. Click for 3D. |
D1 SSS. Axial-equatorial. Click for 3D. |
Amongst the many features visible in these plots is the strong 1,3-diaxial NCIs seen for A2 and particularly D1 and the conformational variability in the NCI between the iPr and NMe3 groups.
In the mid to late 1990s as the Web developed, it was becoming more obvious…
I have written a few times about the so-called "anomeric effect", which relates to stereoelectronic…
The recent release of the DataCite Data Citation corpus, which has the stated aim of…
Following on from my template exploration of the Wilkinson hydrogenation catalyst, I now repeat this…
In the late 1980s, as I recollected here the equipment needed for real time molecular…
On 24th January 1984, the Macintosh computer was released, as all the media are informing…
View Comments