The colour of purple

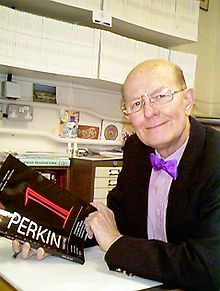
One of my chemical heroes is William Perkin, who in 1856 famously (and accidentally) made the dye mauveine as an 18 year old whilst a student of August von Hofmann, the founder of the Royal College of Chemistry (at what is now  Imperial College London). Perkin went on to found the British synthetic dyestuffs and perfumeries industries. The photo below shows Charles Rees, who was for many years the Hofmann professor of organic chemistry at the very same institute as Perkin and Hofmann himself, wearing his mauveine tie. A colleague, who is about to give a talk on mauveine, asked if I knew why it was, well so very mauve. It is a tad bright for today’s tastes!

Charles Rees, wearing a bow tie dyed with (Perkin original) mauveine and holding a journal named after Perkin.

The first thing to note about mauveine is that it is not a single compound; actual samples can contain up to 13 different forms! These all vary in the number of methyl groups present which range from none up to four, in various positions. These compounds all have absorption maxima λmax in the range 540-550nm, the colour of purple. The structure of one of these, known as mauveine A, is shown below.

Mauveine A. Click to load 3D

You can see from this that something is missing. The so-called chromophore is a cation, and an anion needs to be provided to balance the charge. We will now attempt to predict the color of purple using purely the power of quantum mechanics (for many years, accurate prediction of colour was a holy grail amongst dye chemists for obvious reasons). The anion can be chloride, and the colour is often measured in methanol as solvent. So the first task is to calculate this ion-pair. This used to be easier said than done (and in the past, the anion was often simply neglected). But using the ωB97XD density functional procedure (to get the van der Waals interactions modelled correctly) and a 6-311++G(d,p) basis set, coupled with a smoothed-cavity continuum solvation procedure, and two molecules of water (standing in for methanol, which is a bit bigger) as explicit solvent molecules, we get the structure apparent when you click on the diagram above (DOI: 10042/to-7320). Application of time-dependent density function theory (TD-DFT) gives a measure of the UV-optical spectrum (below, loaded as a scaleable SVG image. If you are using a modern browser, it should display. If not, try the latest FireFox, Chrome, Safari etc).


This has several noteworthy aspects.

  1. The visible (right hand side) part of the spectrum is very monochromatic, with λmax ~440nm. In other words, mauveine has a pure and intense colour.
  2. This λmax is hardly affected by the presence of the counterion.
  3. The electronic transition responsible for this band is a simple HOMO (highest-occupied-molecular-orbital) to LUMO (lowest-unoccupied-molecular-orbital) excitation of an electron.
  4. These orbitals are shown below.
    LUMO HOMO

    Mauveine A. LUMO. Click for 3D

    Mauveine A. HOMO. Click for 3D

  5. Note how the excitation involves the central region of the molecule, and one of the pendant aryl groups, but not the other. One might presume that tuning the colour would only work if changes are made to the first of these aryl groups.
  6. There is a real mystery about the calculated value of λmax, which differs from the observed value by about 100nm (the wrong colour, making mauveine orange rather than purple). Normally, this sort of time dependent density functional theory has errors no greater than 15-20nm. The calculated value of λmax is not sensitive to the basis set, or the presence or not of the counter ion and solvent. Clearly, a discrepancy of this magnitude must have some other explanation. Watch this space!

So this post ends with a bit of a mystery. The fanciest most modern computational theory gets the colour of mauveine wrong by ~100nm. Why?

Henry Rzepa

Henry Rzepa is Emeritus Professor of Computational Chemistry at Imperial College London.

View Comments

  • Inspired by Stefan's suggestions (posted above), and mindful that DFT reparametrisations can "correct" in a non-linear way, I repeated the UV-Vis TD-DFT prediction for mauveine, using exactly the same geometry as was used in the model above, but using a "new generation" of functional, MN12L (DOI: 10.6084/m9.figshare.1148892 ).

    Now the error reduces from ~100nm to ~25nm, which is pretty good agreement. It seems that careful parametrisation of DFT methods can probably achieve better and better reproduction of electronic spectra in this region.

Recent Posts

Detecting anomeric effects in tetrahedral boron bearing four oxygen substituents.

In an earlier post, I discussed a phenomenon known as the "anomeric effect" exhibited by…

2 weeks ago

Internet Archeology: reviving a 2001 article published in the Internet Journal of Chemistry.

In the mid to late 1990s as the Web developed, it was becoming more obvious…

2 months ago

Detecting anomeric effects in tetrahedral carbon bearing four oxygen substituents.

I have written a few times about the so-called "anomeric effect", which relates to stereoelectronic…

2 months ago

Data Citation – a snapshot of the chemical landscape.

The recent release of the DataCite Data Citation corpus, which has the stated aim of…

3 months ago

Mechanistic templates computed for the Grubbs alkene-metathesis reaction.

Following on from my template exploration of the Wilkinson hydrogenation catalyst, I now repeat this…

3 months ago

3D Molecular model visualisation: 3 Million atoms +

In the late 1980s, as I recollected here the equipment needed for real time molecular…

4 months ago