Previously, I explored the Graham reaction to form a diazirine. The second phase of the reaction involved an Sn2′ displacement of N-Cl forming C-Cl. Here I ask how facile the simpler displacement of C-Cl by another chlorine might be and whether the mechanism is Sn2 or the alternative Sn1. The reason for posing this question is that as an Sn1 reaction, simply ionizing off the chlorine to form a diazacyclopropenium cation might be a very easy process. Why? Because the resulting cation is analogous to the cyclopropenium cation, famously proposed by Breslow as the first example of a 4n+2 aromatic ring for which the value of n is zero and not 1 as for benzene.[1] Another example of a famous “Sn1” reaction is the solvolysis of t-butyl chloride to form the very stable tertiary carbocation and chloride anion (except in fact that it is not an Sn1 reaction but an Sn2 one!)
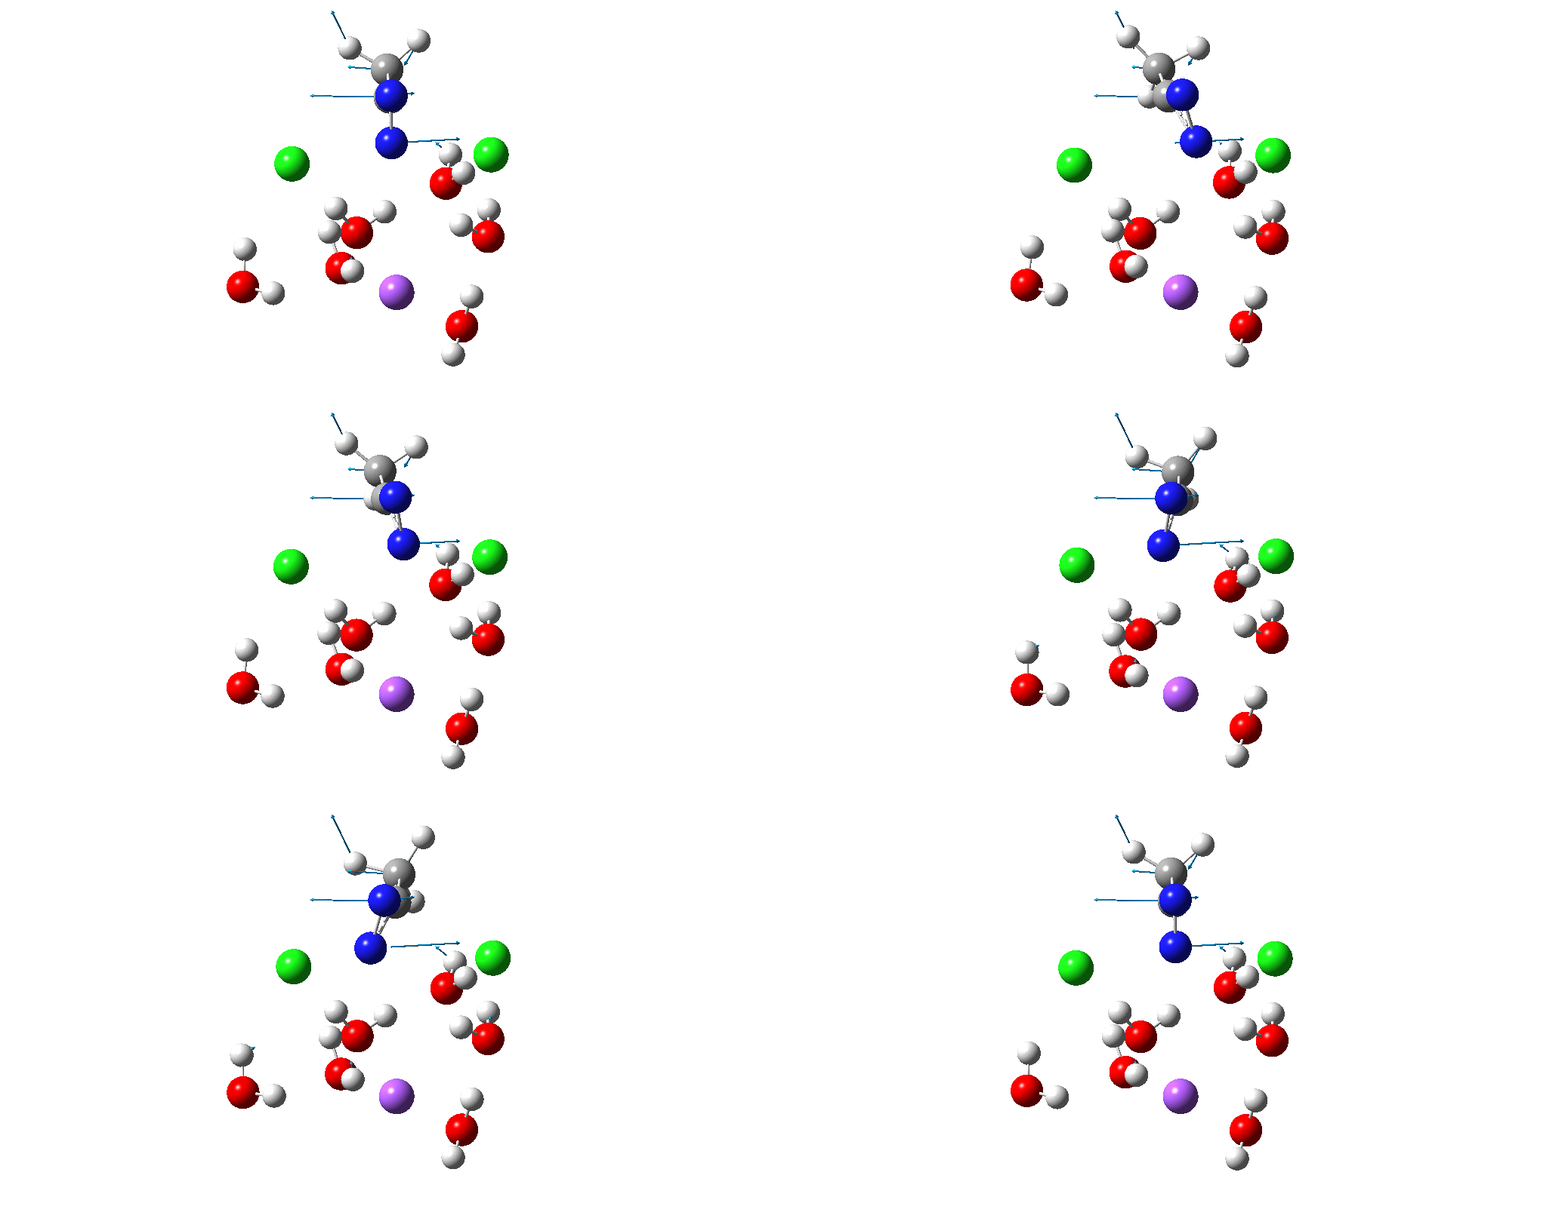
Here is the located transition state for the above, using Na+.6H2O as the counter-ion to the chloride. The calculated free energy of this transition state is 3.2 kcal/mol lower than the previous Sn2′ version (FAIR data collection, 10.14469/hpc/5045), with an overall barrier to reaction of 26.5 kcal/mol. This compares to ~24.5 kcal/mol obtained by Breslow for solvolysis of the cyclopropenyl tosylate. Given the relatively simple solvation model I used in the calculation (only six waters to solvate all the ions, and a continuum solvent field for water), the agreement is not too bad.

The animation above is of a normal vibrational mode known as the transition mode (click on the image above to get a 3D rotatable animated model). The calculated vectors for this mode (its energy being an eigenvalue of the force constant matrix) are regularly used to “characterise” a transition state. I will digress with a quick bit of history here, starting in 1972 when another famous article appeared.[2] The key aspect of this study was the derivation of the first derivatives of the energy of a molecule with respect to the (3N) geometrical coordinates of the atoms, using a relatively simply quantum mechanical method (MINDO/2) to obtain that energy. Analytical first derivatives of the MINDO/2 Hamiltonian were then used to both locate the transition state for a simple reaction and then to evaluate the second derivatives (the force constant matrix) using a finite difference method. That force constant matrix, when diagonalized, reveals one negative root (eigenvalue) which is characteristic of a transition state. The vectors reveal how the atoms displace along the vibration, and should of course approximate to the path to either reactant or product.
Since that time, it has been a more or less mandatory requirement for any study reporting transition state models to characterise them using the vectors of the negative eigenvalue. The eigenvalue invariably expressed as a wavenumber. Because this comes from the square root of the mass-weighted negative force constant, it is often called the imaginary mode. Thus in this example, 115i cm-1, the i indicating it is an imaginary number. The vectors are derived from quadratic force constants, which is a parabolic potential surface for the molecule. Since most potential surfaces are not quadratic, it is recognized as an approximation, but nonetheless good enough to serve to characterise the transition state as the one connecting the assumed reactant and product. Thousands of published studies in the literature have used this approach.
So now to the animation above. If you look closely you will see that it is a nitrogen and not a carbon that is oscillating between two chlorines (here it is the lighter atoms that move most). The vectors confirm that, with a large one at N and only a small one at C. So it is Sn2 displacement at nitrogen that we have located?
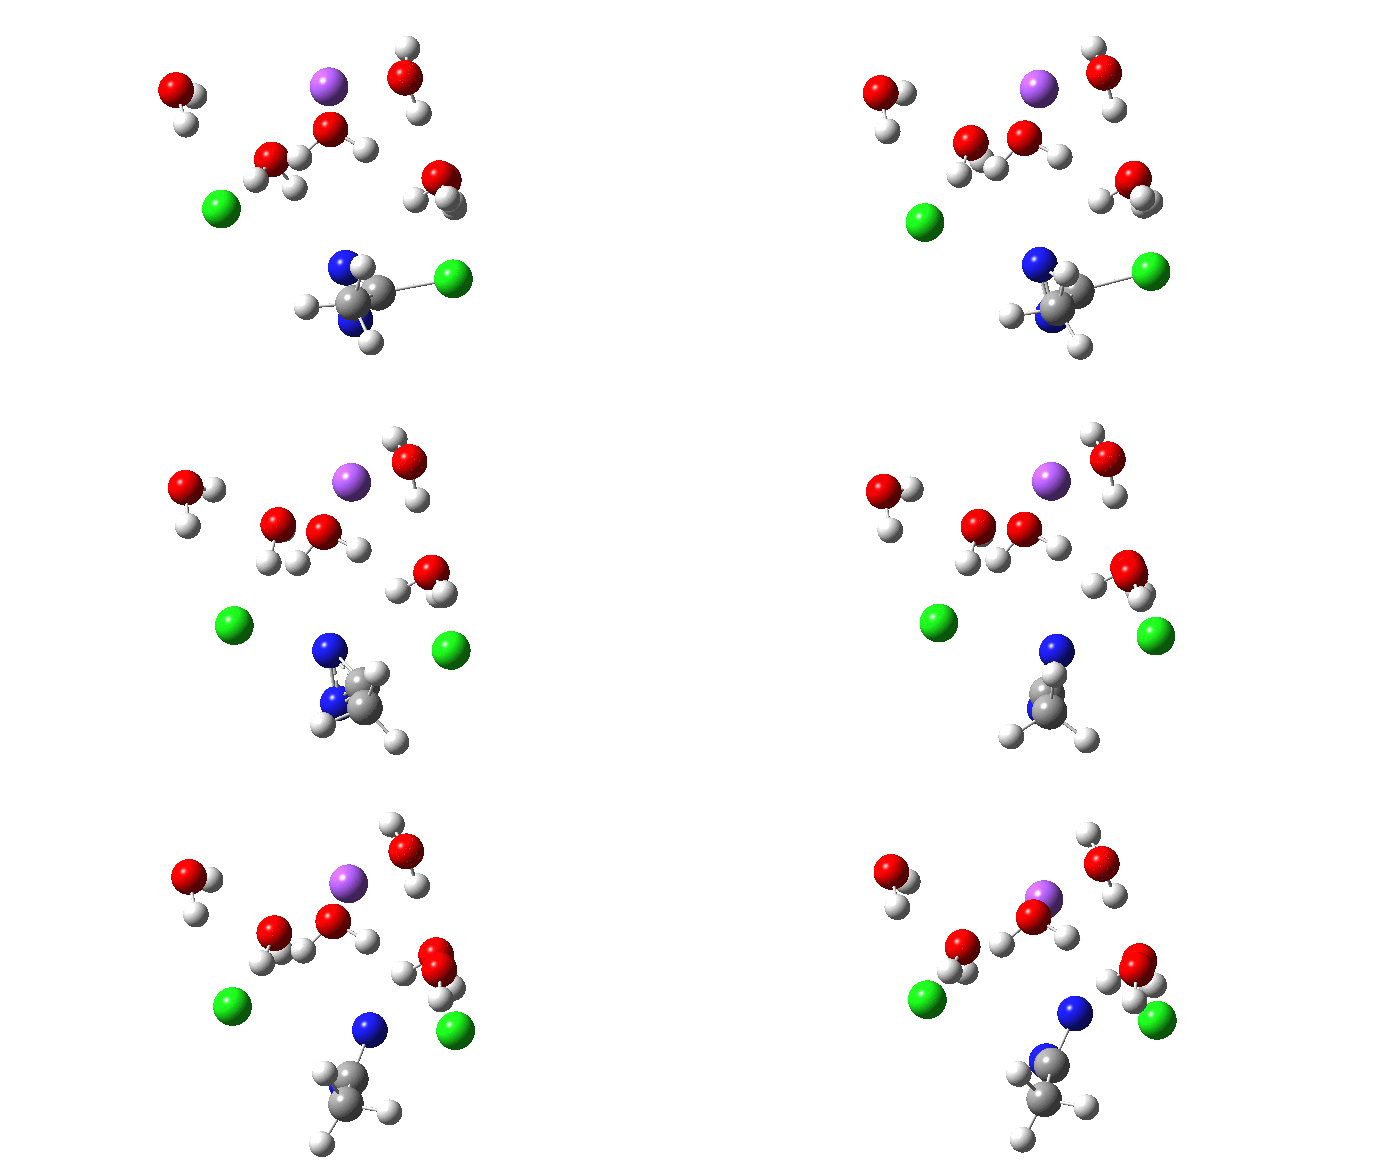
Not so fast. This is a reminder that we have to explore a larger region of the potential energy surface, beyond the quadratic region of the transition state from which the vectors above are derived. This is done using an IRC (intrinsic reaction coordinate). Here it is, and you see something remarkable.
The Cl…N…Cl motions seen above in the transition state mode change very strongly in regions away from the transition state. On one side of the transition state, it forms a Cl…C bond, on the other side a Cl…N.
It is also reasonable to ask why the paths either side of the transition state are not the same? That may be because with only six explicit water molecules, three of which solvate the sodium ion, there are not enough to solvate equally the chloride anions either side of the transition state. As a result one chlorine does not behave in quite the same way as the other. The addition of an extra water molecule or two may well change the resulting reaction coordinate significantly.
The overall message is that there are two ways to characterise a computed reaction path. One involves looking at the motions of all the atoms just in the narrow region of the transition state. Most reported literature studies do only this. When the full path is explored with an IRC, a different picture can emerge, as here. The Cl…N…Cl Sn2 mode is replaced by a Cl…C/N…Cl mode. This example however is probably rare, with most reactions the transition state vibration and the IRC do actually agree!
References
- R. Breslow, "SYNTHESIS OF THE s-TRIPHENYLCYCLOPROPENYL CATION", Journal of the American Chemical Society, vol. 79, pp. 5318-5318, 1957. https://doi.org/10.1021/ja01576a067
- J.W. McIver, and A. Komornicki, "Structure of transition states in organic reactions. General theory and an application to the cyclobutene-butadiene isomerization using a semiempirical molecular orbital method", Journal of the American Chemical Society, vol. 94, pp. 2625-2633, 1972. https://doi.org/10.1021/ja00763a011
Tags: animation, Carbenium ion, Cations, Chemical elements, chemical reaction, Chemistry, Chlorine, computational chemistry, Cyclopropenium ion, Diazirine, energy, energy profile, free energy, Halogens, Natural sciences, Nucleophilic aromatic substitution, Oxidizing agents, Physical sciences, potential energy surface, SN1 reaction, Substitution reactions
