The topic of this post originates from a recent article which is attracting much attention.[cite]10.1038/s41586-019-1059-9[/cite] The technique uses confined light to both increase the spatial resolution by around three orders of magnitude and also to amplify the signal from individual molecules to the point it can be recorded. To me, Figure 3 in this article summarises it nicely (caption: visualization of vibrational normal modes). Here I intend to show selected modes as animated and rotatable 3D models with the help of their calculation using density functional theory (a mode of presentation that the confinement of Figure 3 to the pages of a conventional journal article does not enable).
I should start by quoting some pertinent aspects obtained from the article itself. The caption to Figure 3 includes assignments, which I presume were done with the help of Gaussian calculations. Thus in the Methods section, we find … The geometry of a free CoTPP molecule is optimized under tight convergence criteria using Gaussian 09 (ref. 33). The orientationally averaged Raman spectrum and vibrational normal modes are calculated with the geometry of a free molecule … All the calculations mentioned above are performed at the B3LYP/6-31G* level with the effective core potential at the cobalt centre. Armed with this information, I looked at the data included with the article (the data supporting the findings of this study are available within the paper. Experimental source data for Figs. 1–4 are provided with the paper) but did not spot any data specifically relating to those Gaussian 09 calculations; in particular any data that would allow me to animate some vibrational normal modes for display here. No matter, it is easy to re-calculate, although I had to obtain the basic 3D coordinates from the Cambridge crystal data base (e.g. entry IKUDOH, DOI: 10.5517/cc6hj4b) since they were unavailable from the article itself. At this point some decisions about molecular symmetry needed to be made (the symmetry is not mentioned in the article), since it is useful to attach the irreducible representations (IR) of each mode as a label♥ (lacking in Figure 3). The crystal structure I picked has idealised S4 symmetry, but it could be higher at D2d or lower at C2.
The next issue to be solved is how many electrons to associate with the molecule. Tetraphenylporphyrin has 347 electrons and the free molecule would be expected to be a doublet spin state (with the quartet as an excited state). Were the vibrational modes calculated for this state? Perhaps not since I then found this statement: The physisorbed CoTPP is positively charged on gold, as demonstrated through TERS measurements using CO-terminated tips24 and through the Smoluchowski effect29…. In contrast to gold, the Kondo resonance of cobalt disappears on Cu(100), suggesting that it acquires nearly a full electron from the metal (see Extended Data Fig. 2). So it seems worth calculating both the cation and the anion singlets as well as the neutral doublet. But at this stage we do not know for certain what spin state the Gaussian 09 assignments in Figure 3 were done for, since there is no data associated with the article to tell us, only that they were done for the free molecule (nominally a doublet).
There is one more remark made in the article we need to take into account: After lowering the sample bias to approach the molecule and scanning at close range, the molecule flattens. Its phenyl rings, which in the free molecule assume a dihedral angle of 72°, rotate to become coplanar (see Extended Data Fig. 1b). Evidently, the binding energy of the phenyl groups to copper overcomes the steric hindrance in the planar geometry. So it might be useful to calculate this “flattened” form to see how much steric repulsion energy needs to be overcome by that binding of the phenyl groups to the surface of the metal.
Finally, I decided to not try to replicate exactly the reported calculations (B3LYP/6-31G(d)) since this type of DFT mode does not include any dispersion attraction terms; moreover by today’s standards the basis set is also rather small. So here you have an ωB97Xd/6-311G(d,p) calculation, with tight convergence criteria (integral accuracy 10-14 and SCF 10-9; again we do not know what values were used for the article). To ensure that my data is as FAIR as possible, here is its DOI: 10.14469/hpc/5461
| charge | Multiplicity | ΔG, Twisted Ph Hartree |
ΔG, Co-planar Ph Hartree |
ΔΔG, kcal/mol |
|---|---|---|---|---|
| 0 | Doublet | -3294.58693 | -3294.48867 | 61.7 |
| 0 | Quartet | -3294.58777 | -3294.51985 | 42.6 |
| +1 | Singlet | -3294.35473 | -3294.24973 | 65.9 |
| +1 | Triplet | -3294.40821 | -3294.33092 | 48.5 |
| -1 | Singlet | -3294.67713 | -3294.56652 | 69.4 |
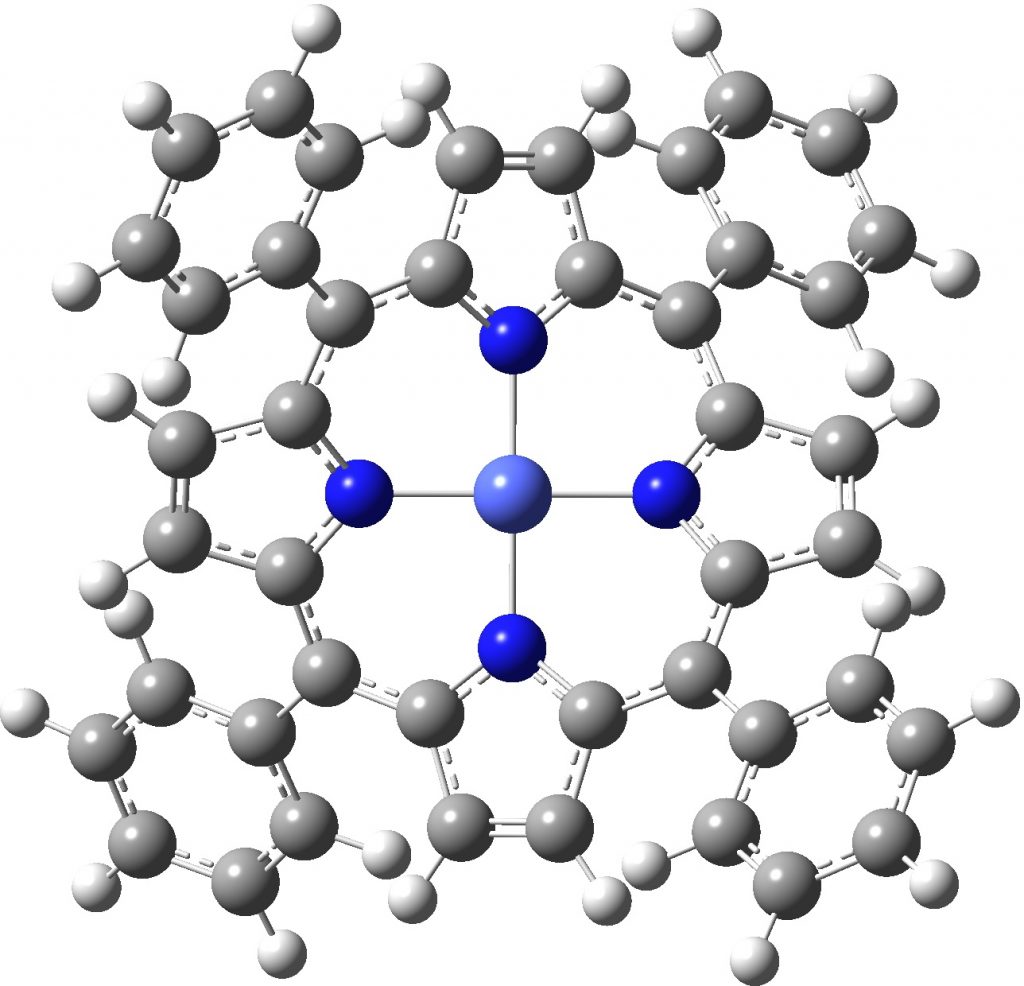
Starting with a singlet cation as a model, the intent is to compare the “free molecule” energy with that of a flattened version where the dihedral angles of the phenyl rings relative to the porphyrin ring are constrained to ~0° rather than ~72°. This emerges as a 4th order saddle point (a stationary point with four negative roots for the force constant matrix). Such a property means that each co-planar phenyl group is independently a transition state for rotation. The calculated geometry overall is far from planar, having S4 symmetry. The image below in (a) shows how non-planar the molecule still is; (b) an attempt to orient it into the same position as is displayed in Figure 3 of the article.[cite]10.1038/s41586-019-1059-9[/cite]
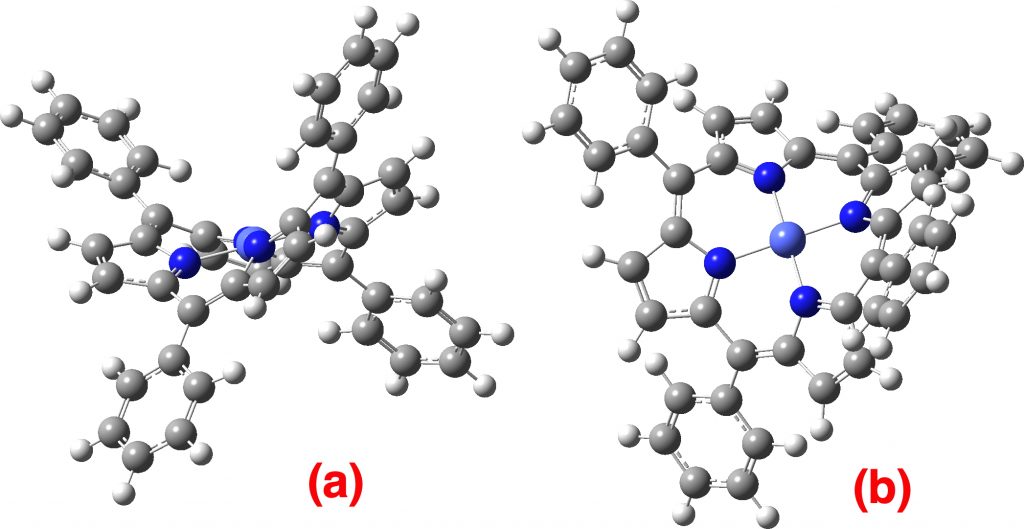
Singlet cation. Click on the image to get a rotatable model.
The free energy ΔG is 65.9 kcal/mol higher than the twisted form, which means that according to the model proposed, the binding energy of the phenyl groups to copper must recover at least this much energy. If we consider a cationic porphyrin interacting with an anionic metal surface as an ion-pair, then this is perhaps feasible. It is difficult however to see how more than two of the phenyl rings can simultaneously interact with a flat metal surface.
Next, the triplet state of the cation, again a 4th-order saddle point with a rotational barrier of ΔG‡48.5 kcal/mol; the triplet being 33.6 kcal/mol lower than the singlet using this functional (singlet-triplet separations can be quite sensitive to the DFT functional used).
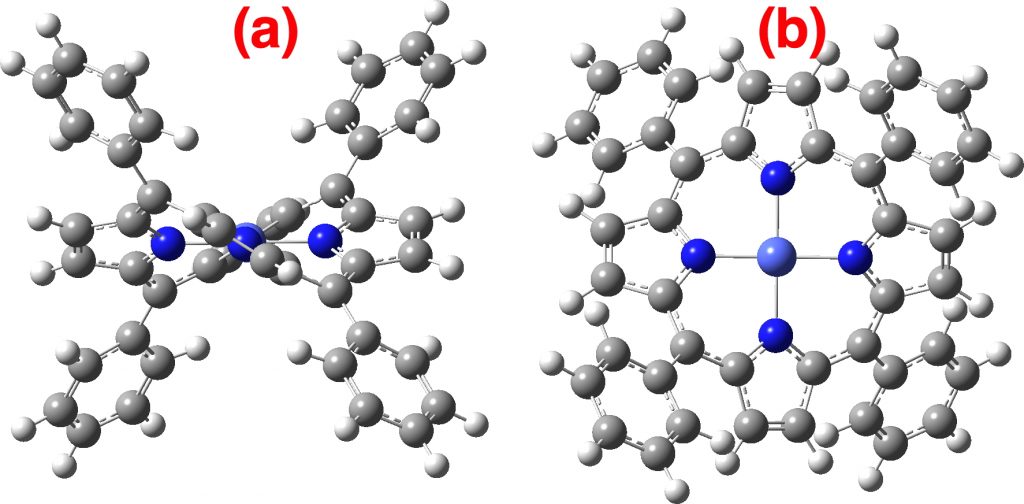
Triplet cation. Click on the image to get a rotatable model.
Next, the neutral doublet, another 4th-order saddle point and below it the quartet state, which this time is just a 2nd-order saddle point (an interesting observation in itself).
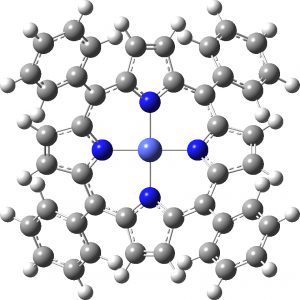 Neutral Doublet |
 Neutral Quartet |
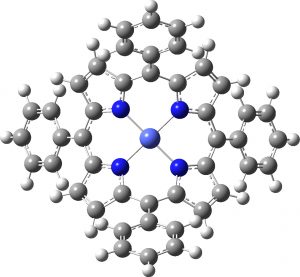
Finally, the “flattened” singlet anion, which also emerges as a 4th-order saddle point (the triplet state has SCF convergence issues which I am still grappling with).
Singlet anion
To inspect the vibrational modes of any of these species, click on the appropriate image to open a JSmol display. Then right-click in the molecule window, navigate to the 3rd menu down from the top (Model – 48/226), where the frames/vibrations are ordered in sets of 25. Open the appropriate set and select the vibration you want from the list of wavenumbers shown. The preselected normal mode is the one identified in Figure 3 as 388 cm-1, the symmetric N-Co stretch (I note the figure 3 caption refers to them as vibrational frequencies; they are of course vibrational wavenumbers!). You can also inspect the four modes shown as negative numbers (correctly as imaginary numbers) to see how the phenyl groups rotate. If you want to analyze the vibrational modes using other tools (the free Avogadro program is a good one), then download the appropriate log or checkpoint file from the FAIR data archives at 10.14469/hpc/5461.
I conclude by noting that the aspect of this article which I presume reports the Gaussian normal vibrational mode calculations (Figure 3, caption Bottom, assigned vibrational normal modes), has been a challenging one to analyse.† Neither the charge state nor the spin state of these calculations is clearly indicated in the article (unless I missed it somewhere). The barriers to flattening out the molecule by twisting all four phenyl groups are unreported in the article, but emerge as substantial from the calculations here. The various species I calculated (summarised in the table and figures above) are all predicted to be non-planar. In the absence of provided coordinates with the article, the visual appearances (bottom row, Figure 3) are the only information available. These certainly appear flat and rather different from my projections shown above or below.
All of which amounts to a plea for more data and especially FAIR data to be submitted, providing information such as the charge and spin states used for the calculations, along with a full listing of all the normal mode vectors and wavenumbers. The article is only a letter at this stage; perhaps this information will appear in due course!
†As noted above I have not attempted a direct replication, not least because there is no reported data to which any replication could be compared. ♥The IRs of each vibrational mode are displayed along with the wavenumber when the 3D JSmol display is shown with a right-mouse-click.
Author
Tags: anionic metal surface, Cambridge, chemical bonding, Chemistry, dihedral, energy, flat metal surface, metal, Natural sciences, Neutral Quartet, Physical sciences, Raman scattering, Raman spectroscopy, Resonance, spectroscopy, steric repulsion energy