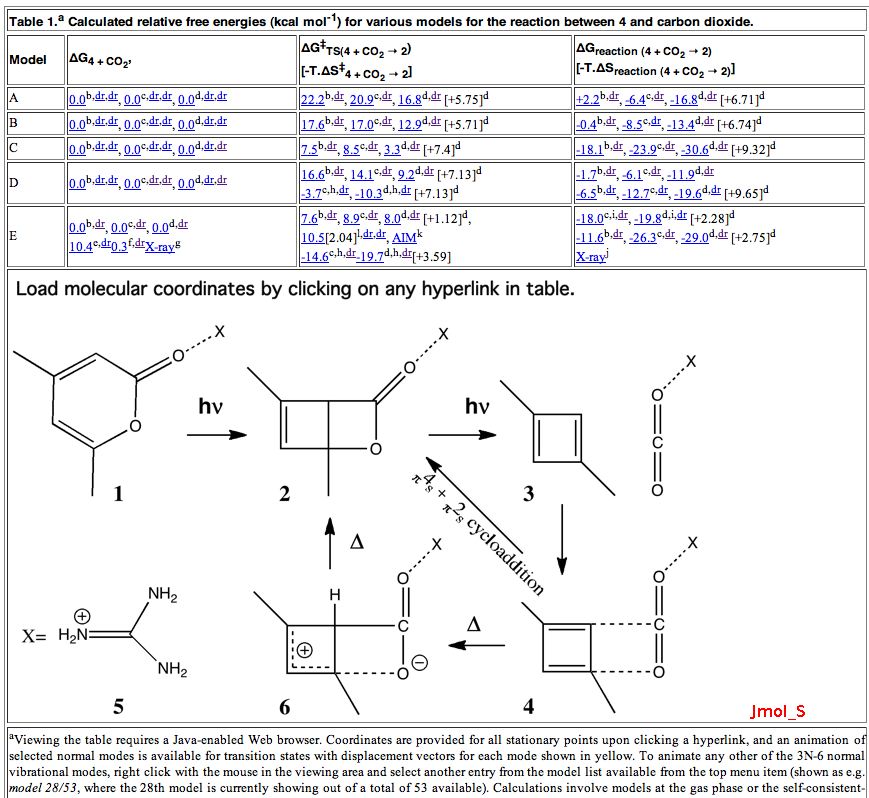
If you visit this blog you will see a scientific discourse in action. One of the commentators there notes how they would like to access some data made available in a journal article via the (still quite rare) format of an interactive table, but they are not familiar with how to handle that kind of data (file). The topic in question deals with various kinds of (chemical) data, including crystallographic information, computational modelling, and spectroscopic parameters. It could potentially deal with much more. It is indeed difficult for any one chemist to be familiar with how data is handled in such diverse areas. So I thought I would put up a short tutorial/illustration in this post of how one might go about extracting and re-using data from this one particular source.
The above is a snapshot of part of the table in question, with a box in the middle set aside for a Jmol applet to appear. What might be both less obvious, and less familiar to many who might have seen such a display is the very rich environment available for manipulating the data. To expose some of this, proceed as follows:
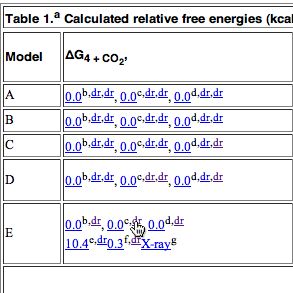
- Firstly, load a molecule into the Jmol window by clicking on e.g. the hyperlink shown below.
- The display shown below will appear, in this case a set of coordinates used to present a 3D model of a molecule, which can be rotated, zoomed, etc. It also has been labelled with various selected bond lengths etc.
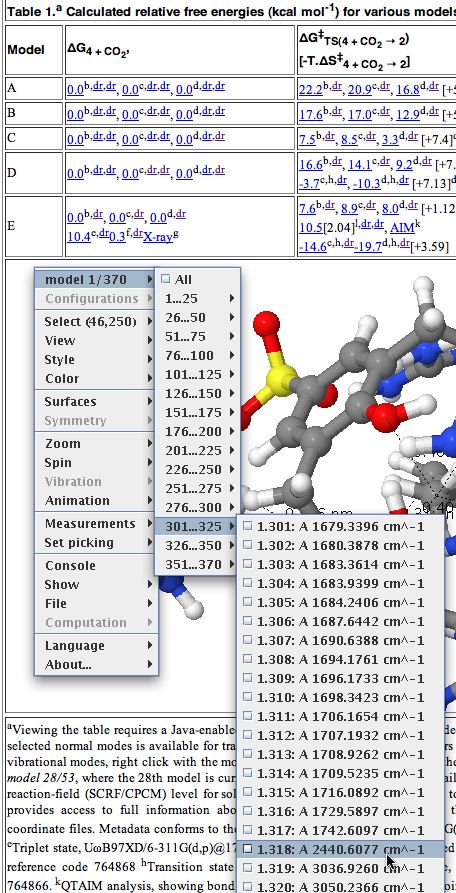
- To extract data, right-click anywhere in the molecule area. Navigate through the menus which appear as shown below. In this case, the data is present in the form of a Gaussian log file. This can contain the history of the particular calculation performed (e.g. a geometry optimisation) or as in this case, all 3N-6 calculated normal vibrational modes. The one of interest here is number 318, being an O=C=O stretching mode.
- This mode can now be manipulated visually by selecting various parameters:
- Jmol has a scintillating display of other options, and more are being added all the time, so the above display is by no means the limit of what one can do.
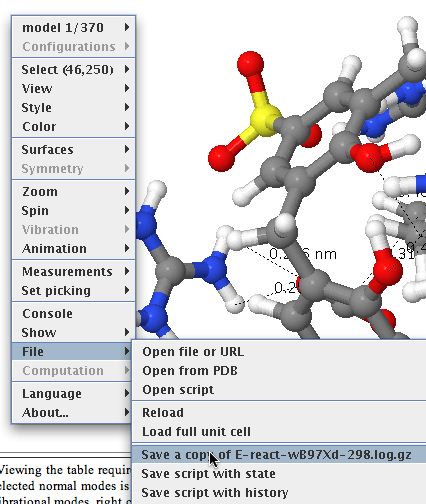
- Now to the most important bit. Invoke the menu as shown below, whereupon a copy of the relevant file (gzipped in this case to reduce its size) will be downloaded to your local system. You will now need to use a program on your own computer capable of reading and processing such a file (after unzipping).
- There may be a bewildering variety of programs and toolkits which may perform the operation you wish on such a file. Some are commercial, some are open source. To help people get going, I link to one of the latter type here, You might also want to visit the Quixote project for ideas.
- We are not quite finished yet. Perhaps a Gaussian log file does not suite your purpose. Well, now try clicking on this link
- This produces a page such as below, which contains more files. In this example, several molecular identifiers are present (InChI and InChI key) to help identify the uniqueness of the system, the molecular coordinates are available as a .cml file which itself can be processed by a variety of software tools, the original file used to run the calculation can be inspected (if you want to eg repeat it) as input.gjf, the logfile we have seen above, and a checkpoint file, which is most useful when using either the Gaussian program system or a visualiser (Gaussview, ChemBio3D etc, both commercial programs). A SMILES string is also offered, and sometimes (not in this example) a so-called wavefunction file which can be used by some programs to analyse the wavefunction, and perform e.g. QTAIM, ELF, NCI analyses.
It is now up to the user to identify suitable processing programs on their computer which fit their purpose.
- There is one other file present which I have not yet explained, the mets.xml manifest. This is a metadata file, containing (along with much else) an RDF declaration of (some) of the properties of the molecule. In theory at least, this file could be automatically harvested for the RDF, which could be injected into a triple store, and queried semantically using eg SPARQL. That is part of the semantic web.
I hope some of the screenshots here make the process of extracting data from an interactive table article a little more obvious. I must declare that this way of doing it is just one of the ways being explored and also (much to my regret) is not yet particularly common. But hopefully you might capture a little of what some of us believe to be the future of scientific journals.
Tags: chemical, chemical journals, chemist, opendata, RDF, semantic web, software tools, suitable processing programs, XML


For instructions on how to enable data availability in a blog such as this, see the comment appended to this post
[…] the cavity. The first would argue that they have reacted to form a different molecule. You can inspect the 3D coordinates by clicking on the diagram […]
The problem is that smart scientists require this to be automatically done by Excel. Yes, the do everything in Excel 🙂 I guess the only way to get Joe Scientist blogging, is to develop an Excel plugin.
It is a lesson for us that I have only switched on the enable the reader to download data option on this blog:
onclick="jmolInitialize('../Jmol/',true);recently. No-one had ever requested it!
I have the following story to tell from ~1996. We had switched on rotatable (in those days, Chime) models in Chemical Communications. The authors of high profile articles had been asked by the RSC to provide molecular coordinates. When the article went live, one of these authors wrote into the Editor-in-Chief, complaining bitterly that the graphics images in his article were low resolution. Surely the journal could do better? He had to be informed that in fact the image he was complaining at, if not in high resolution, was at least rotatable and manipulable (the molecule itself was a complex inter-twined catanane). The author had simply not cottoned on to the purpose of providing coordinates, or that an image could be something other than static.
[…] at the heart of what they do). Each of the first three above sound like a closed system, and extracting re-usable content is, I argue, an essential part of doing science. I am just a tad worried that the approaches […]
[…] to extract molecular data from the “sandboxes“. This last comment relates to the re-usability of data, which I particularly […]
[…] a single example, resident as it happens on a different repository). The reader can choose use just the presentation layer or the underlying […]