Another foray into one of the more famous anecdotal chemistry “models”, the analysis of which led directly to the formulation of the WoodWard-Hoffmann (stereochemical) rules for pericyclic reactions. Previously, I tried to produce a modern computer model of what Woodward might have had to hand when discovering that the stereochemical outcome of a key reaction in his vitamin B12 synthesis was opposite to that predicted using his best model of the reaction.

Such computer models generate quite accurate 3D coordinates of the transition state for the reaction and this can be most simply analysed for finding e.g. steric clashes. These are when two atoms (mostly hydrogen) approach too close to one another. But we now know that in the region 1.9 – 2.4Å these close approaches can be attractive as well as repulsive and so distances alone are not the complete story. Here I analyse these models using a technique known as non-covalent-interactions (NCI). This is based on the electron density and its reduced density gradients♥ and it explores not merely simply distances between atoms but the non-bonded or weakly interacting regions of a molecule, generating a colour coded surface of interaction rather than pairwise distances. The colour coding goes from red (strongly destabilising, or repulsive regions) to blue (stabilising or attractive regions), with green representing weakly stabilising and yellow weakly destabilising. It gives a much more rounded picture of the entire molecule.
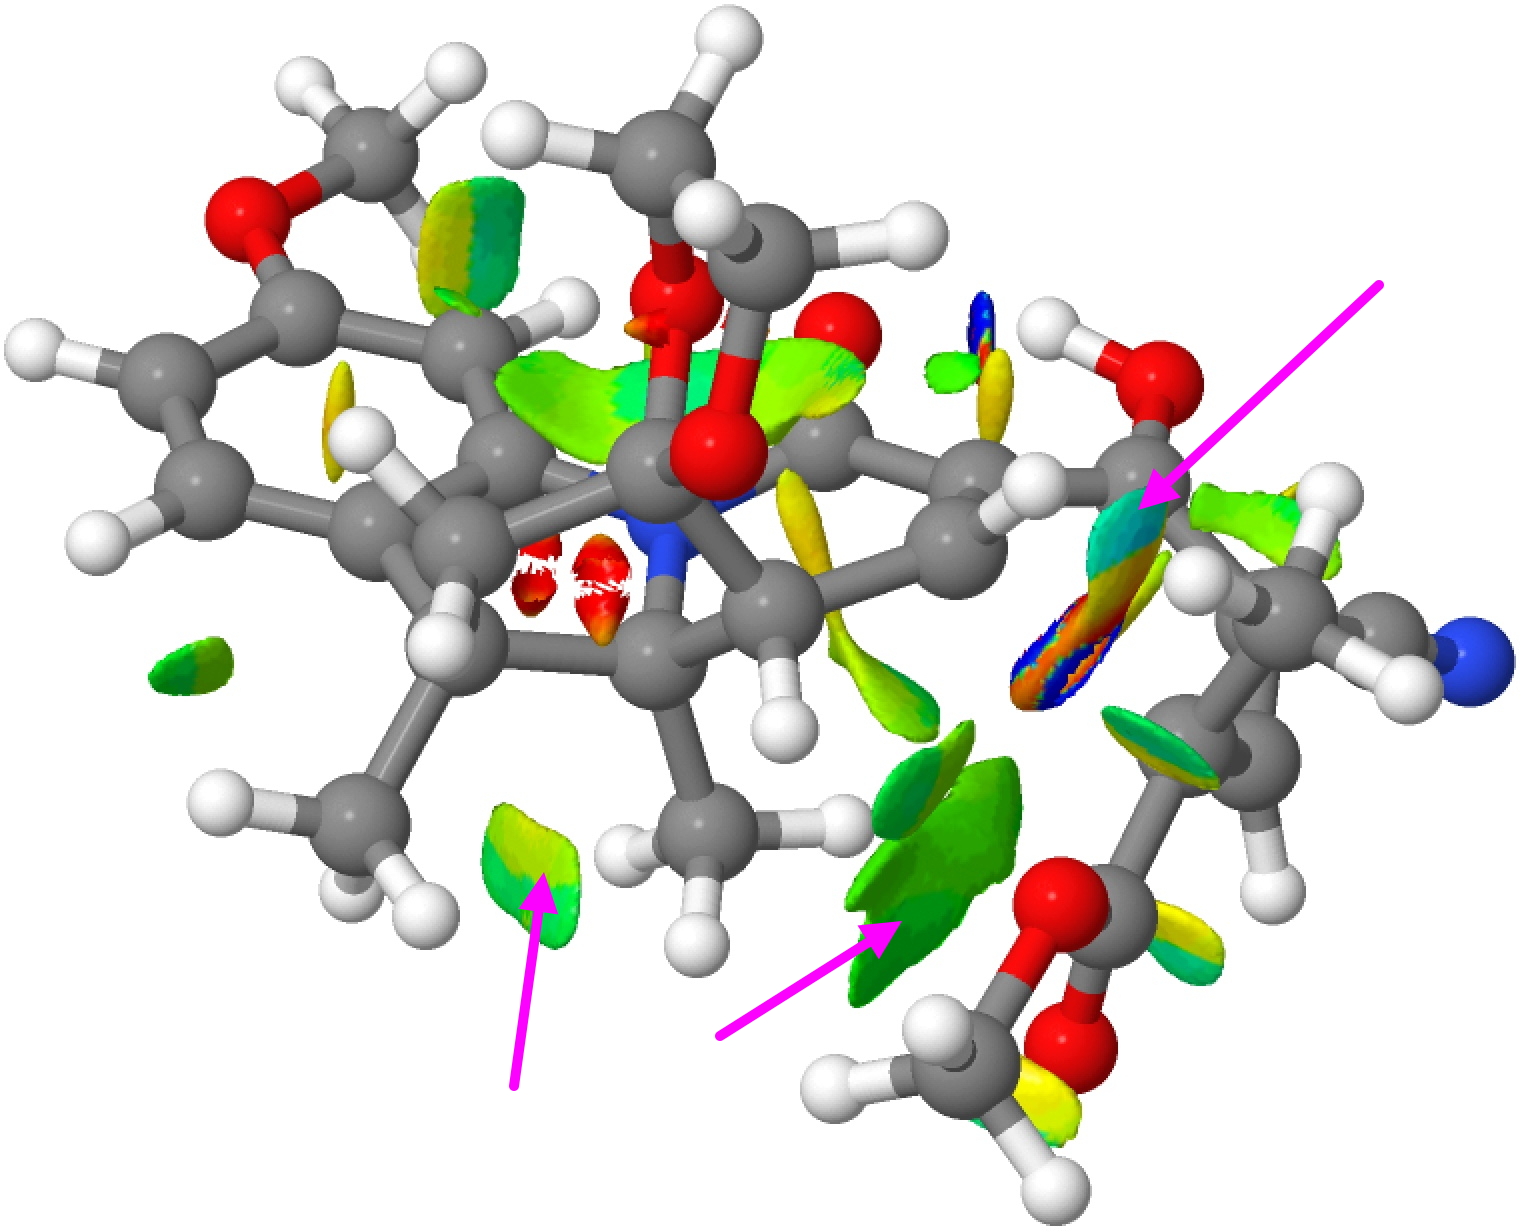
Disrotatory TS for G to H, Click for 3D
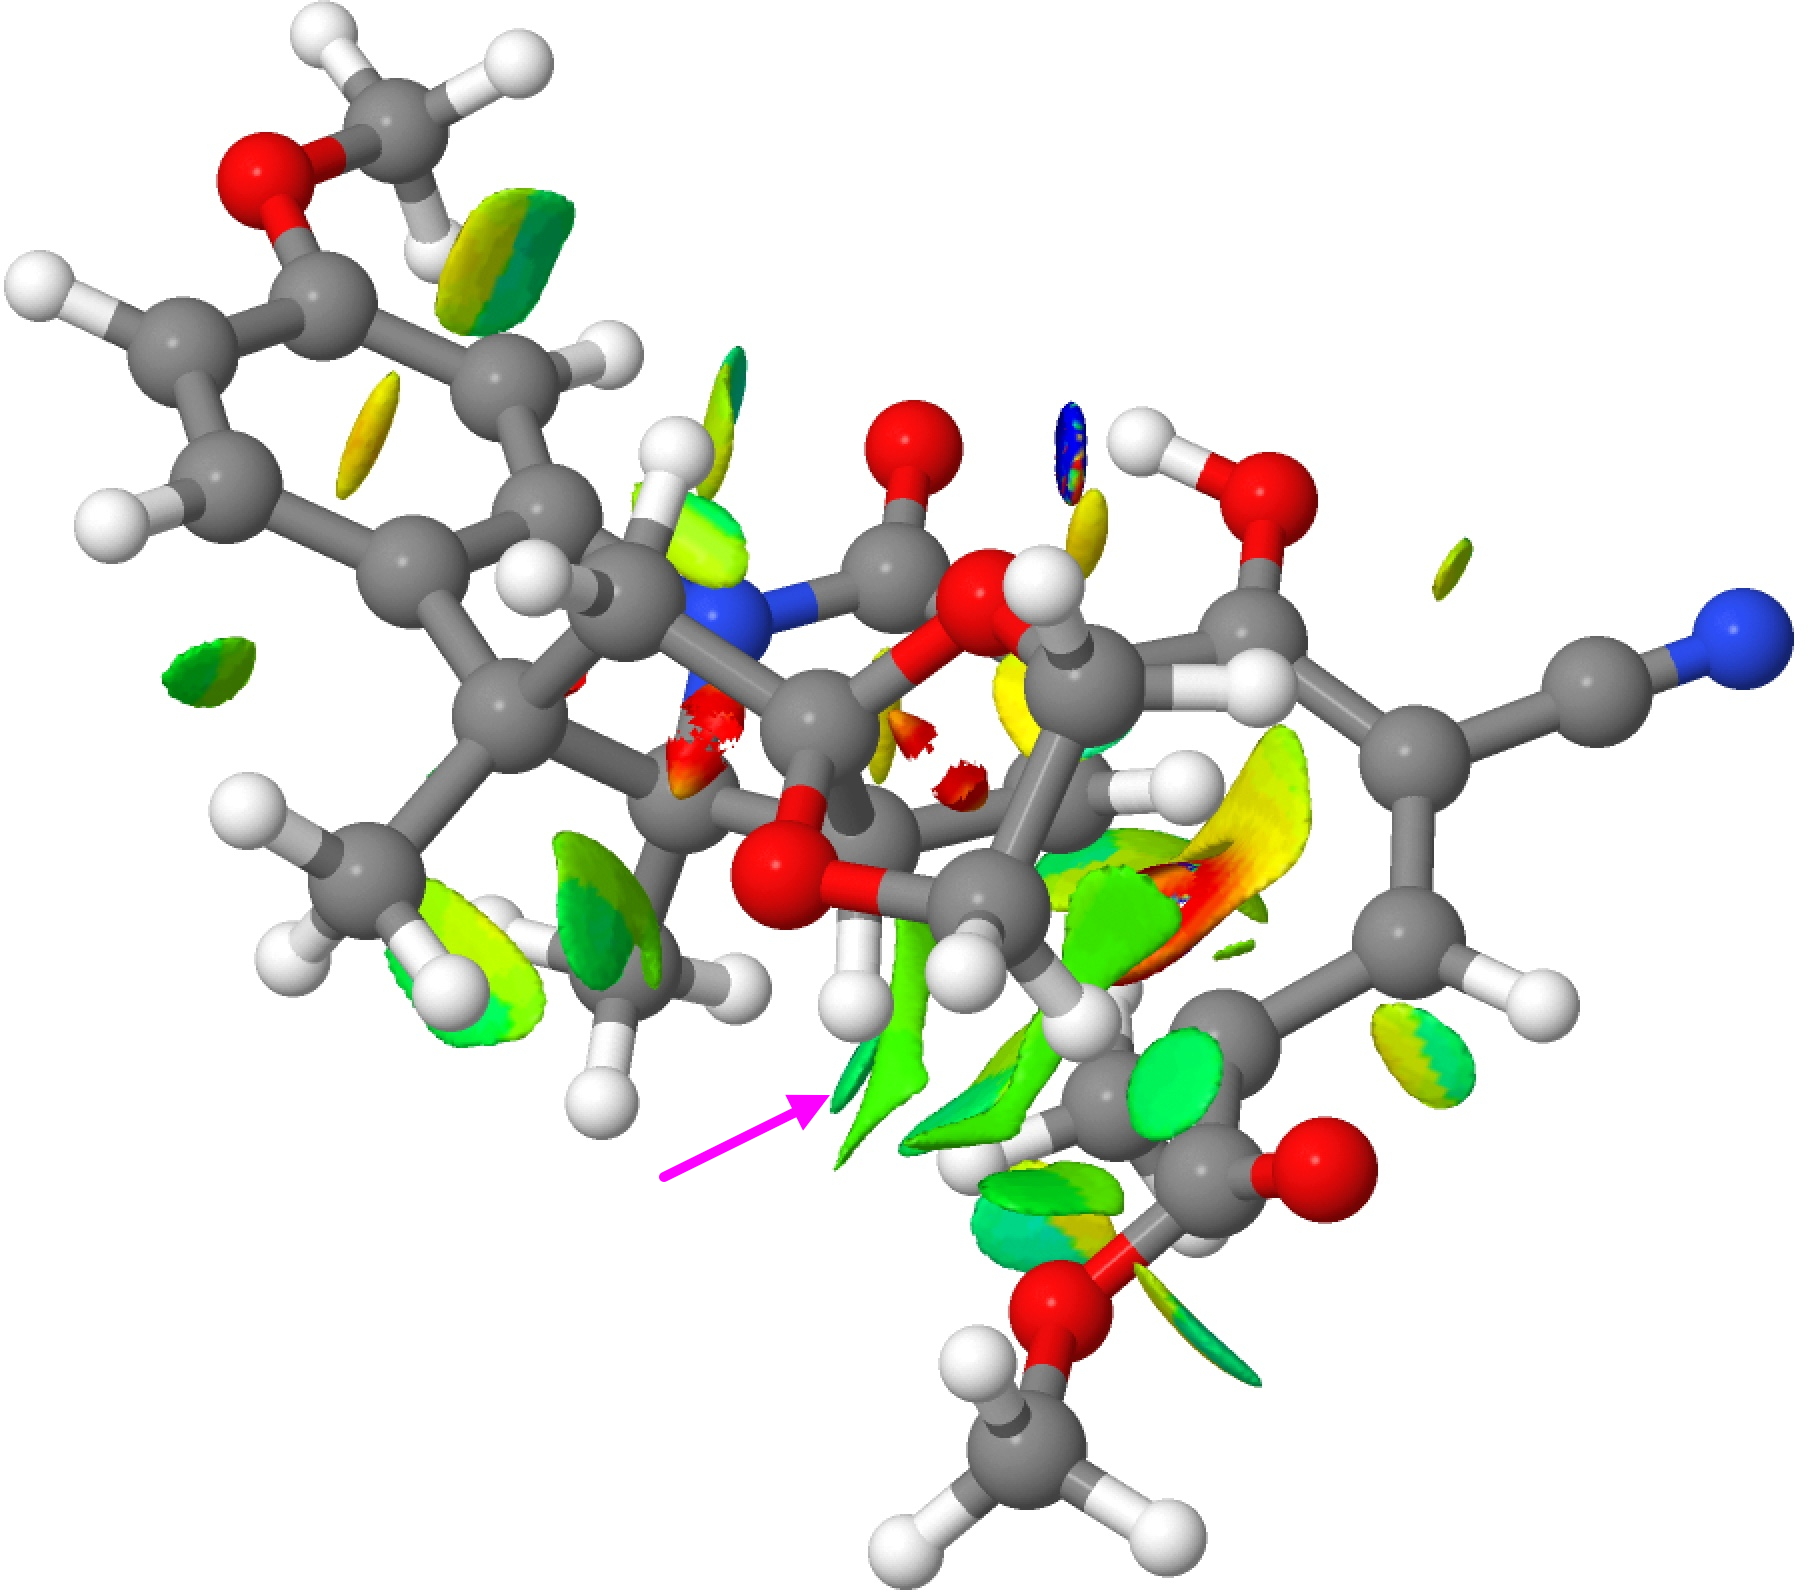
Conrotatory “TS” for G to J, Click for 3D
The NCI surfaces are shown above and are best expanded into a rotatable 3D model by clicking on either image. Regions of interest are shown with arrows. The region of the “steric clash” identified for the (thermal) transition state G to H (the one actually found by experiment) can be seen with the arrow in the top right.‡ It is colour coded light blue (attractive; note the very attractive dark blue for the O…HO hydrogen bond in the system), but it is immediately next to a yellow/orange region (repulsive). This again reminds us that “stabilising” and “destabilizing” regions of a molecule can be adjacent to each other, something that physical models cannot convey. The steric clash for the “transition state” G to J (in quotes because it is actually a transition state calculated for the excited triplet state and not the ground state) is indicated with the arrow, being a clash of two methyl groups. It is coded green, indicating weak NCI stabilization.
So, in this analysis, steric clashes become more complex as indicators of reaction outcomes, since it is the overall balance of stabilisation and destabilisation that determines this. You might argue that Woodward would have found this modern analysis far too woolly to be useful in the sense he used, which is as an alert for the possibility of a new principle in organic reaction mechanisms and certainly a Nobel prize for his collaborator Hoffmann!
‡The region of the C-C bond which is forming in this transition state has a very non-standard electron density, to which this analysis cannot really be applied. So that region should be disregarded for the “non-covalent” analysis being done here. ♥Plots a reduced density isosurface, colour mapped with ABS(ρ)*SIGN(λ2), where λ2 is the middle eigenvalue of the Hessian matrix of the electron density. A web page for generating such surfaces can be found at DOI: ftkt.
Tags: Historical, pericyclic