The title might give it away; this is my 500th blog post, the first having come some eight years ago. Very little online activity nowadays is excluded from measurement and so it is no surprise that this blog and another of my "other" scholarly endeavours, viz publishing in traditional journals, attract such "metrics" or statistics. The h-index is a well-known but somewhat controversial measure of the impact of journal articles; here I thought I might instead take a look at three less familiar ones – one relating to blogging, one specific to journal publishing and one to research data.
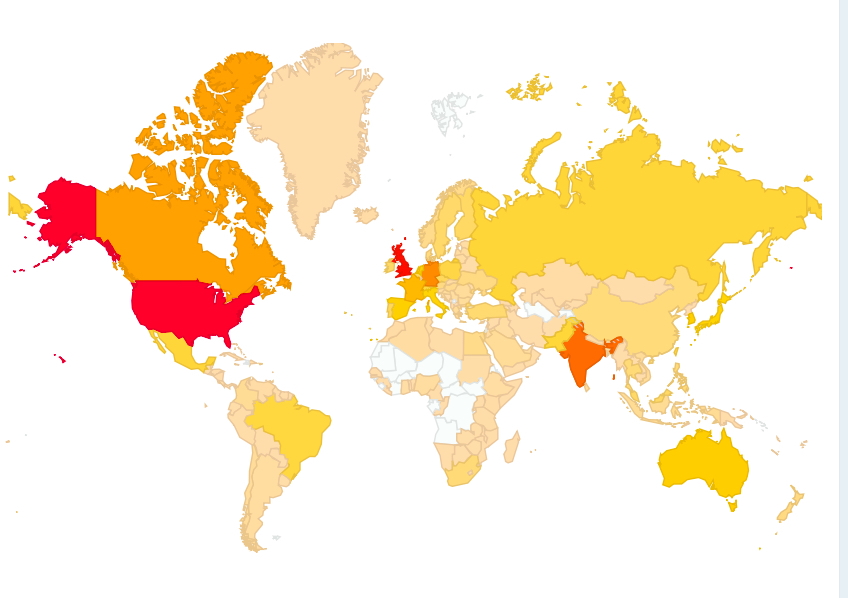
First, an update on the accumulated outreach of this blog over this seven-year period. The total number of country domains measured is 190. The African continent still has quite a few areas with zero hits (as does Svalbard, with a population of only 2600 for a land mass area 61,000 km2 or 23 km2 per person). Given the low blog readership density on the African continent, it would be interesting to find out whether journal readership is any better.
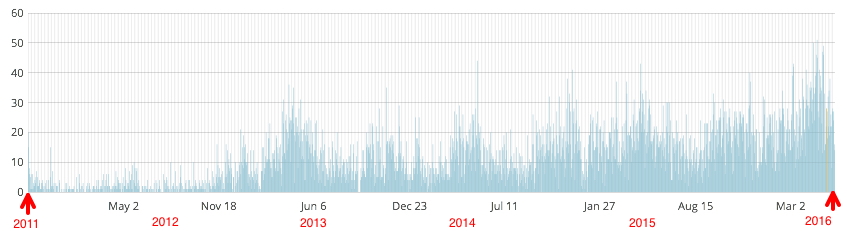
Next, I look at the temporal distribution for individual posts. The first has attracted the highest total; in five years it has had 19,262 views (the diagram below shows the number of views per day). Four others exceed 10,000 and 80 exceed 1000 views.
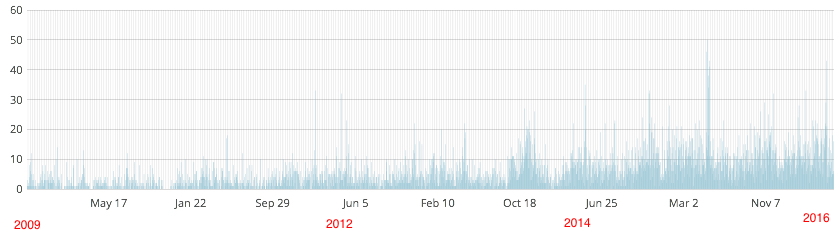
Of these five, the next is the oldest, going back to 2009. I was very surprised to find such longevity, with the number of views increasing rather than decreasing with the passage of time.
So time now to compare these statistics with the journals. And of course its chalk and cheese. A "view" for a post means someone (or something) accessing the post URL, which is then recorded in the server log. Resolving the URL does at least load the entire content of the post; whether its read or not is of course not recorded. Importantly, if you want to view the content at some later stage, a new "view" has to be made (although some browsers do save a web page and allow offline viewing at a later stage, but I suspect this usage is low). With electronic journal access, it's rather different. Access to an article is now predominantly via two mechanisms:
- From the table of contents (this is somewhat analogous to browsing a blog)
- From the article DOI.
Statistics for these two methods are gathered differently. The new CrossRef resource chronograph.labs.crossref.org (CrossRef allocate all journal DOIs) can be used to measure what they call DOI "resolutions". A DOI resolution however leads one only to what is called the "landing page", where the interested reader can view the title, the graphical abstract and some other metadata. It does not mean of course that they go on to actually view the article (as HTML, equivalent to the blog above, or probably more often by downloading a PDF file). Here are a few results using this method:
-
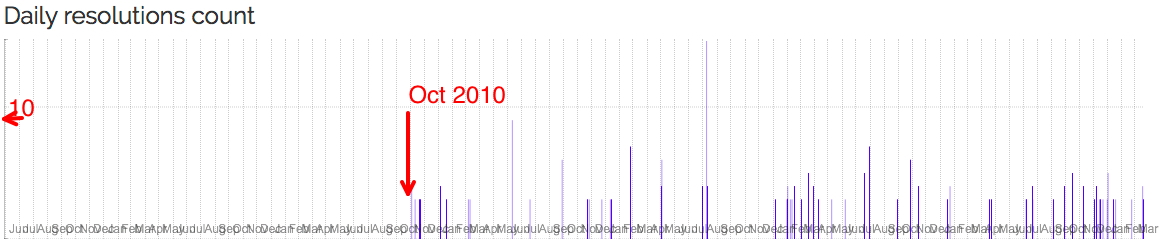
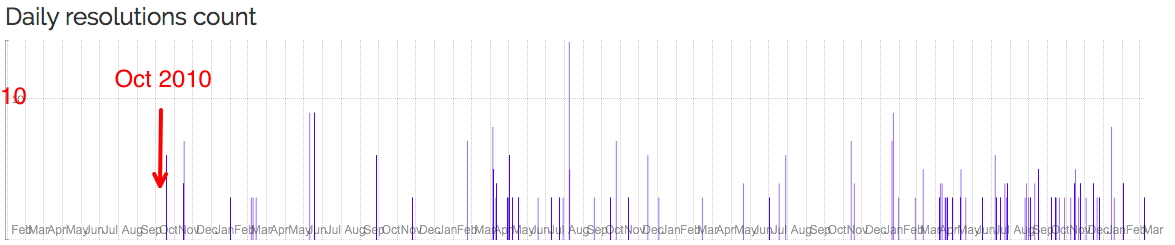
chronograph.labs.crossref.org/dois/10.1021/ja710438j tracks this article[1] which I selected (in part) because it was published in 2008, just slightly before the oldest post above. In fact, the resolutions log only goes back to October 2010, by which time the initial flush of any interest in this article would have subsided and so its nice to see continuing interest (= impact?).
-
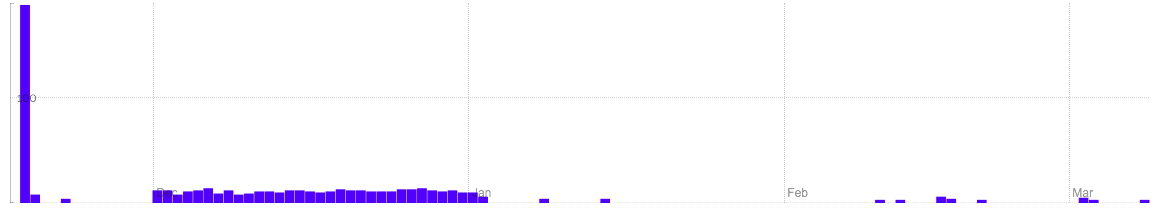
chronograph.labs.crossref.org/dois/10.1002/anie.201409672 [2] totals 208 resolutions, but as the graph below shows, 188 of these were on the first day of publication (Nov 19, 2014), then a few days gap and then about a month of daily resolutions, followed by occasional interest since then.
-
chronograph.labs.crossref.org/dois/10.1126/science.1181771 dates from 2010[3] and this time shows no peak on the first day, but again steady continuing interest to a current 245 resolutions.
What about the other main journal article access method, not via a DOI but from a table of contents page journal page? A Google search revealed this site: jusp.mimas.ac.uk (JUSP stands for Journal usage statistics portal, which sounded promising). This site collects "COUNTER compliant usage data". COUNTER (Counting Online Usage of Networked Electronic Resources) is an initiative supported by many journal publishers and it sounds an interesting way of measuring "usage" (as opposed to "views" or "resolutions"; it's that chalk and cheese again!). I would love to be able to show you some statistics using this resource, but the "small print" caught me out: "JUSP gives librarians a simple way of analysing the value and impact of their electronic journals". Put simply, I am a researcher, not a librarian. As a researcher I do not have direct access; JUSP is a closed, restricted access (albeit taxpayer-funded) resource. I am discussing this with our head of information resources (who is a librarian) and hope to report back here on the outcome.
Finally research data. This is almost too new to be able to measure, but this resource stats.datacite.org is starting to collect statistics on data resolutions (similar to DOI resolutions).
-
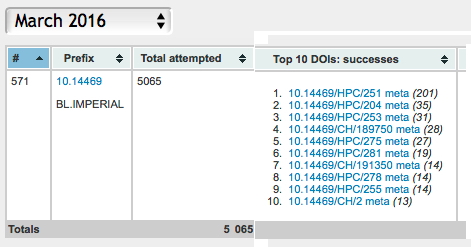
You can see from the below for Imperial College (in fact this represents the two data repositories that we operate and which I cite here extensively on these blogs) that the resolution at running up to about 200 a month per dataset (more typically ~25 a month), with a total of 5065 resolutions for all items in March 2016 (the blog has ~12,000 views per month).
-
Figshare is another data repository we have made use of:
So to the summary.
- Firstly, we see that I have shown three forms of impact, views, resolutions and usage. If one had statistics on all three, one might then try to see if they are correlated in any way. Even then, normalisation might be a challenge.
- Over ~7 years, five posts on this blog have attracted >10,000 views.
- Many of the blog posts have a long "finish" (to use a wine tasting term); the views continue regularly and often increase over time.
- My analysis of the three journal articles above (and about 15 others) shows that between 50-300 resolutions over a few years is fairly typical (for this researcher at least; I am sure most better known researchers attract far far more).
- The temporal distribution for article resolutions and blog views show both can have continuing impact over an extended period. None of the 18 articles I looked at show a significantly increasing impact with time but many of the blog posts do. This tends to suggest that the audiences for each are quite different; researchers for articles and a fair proportion of inquisitive students for the blog?
- I may speculate whether a correlation between my article resolutions and my h-index probably might be found, but the article resolution has a fine-grained temporal resolution (allowing a derivative wrt time to be obtained) that is perhaps potentially more valuable than just the coarse h-index integration (an article can of course be cited for both positive and negative reasons!).
- Initial analysis for data shows resolutions running at a similar rate to article resolutions. It is not yet possible to correlate data resolutions with article resolutions in which that data is discussed.
References
- S.M. Rappaport, and H.S. Rzepa, "Intrinsically Chiral Aromaticity. Rules Incorporating Linking Number, Twist, and Writhe for Higher-Twist Möbius Annulenes", Journal of the American Chemical Society, vol. 130, pp. 7613-7619, 2008. http://dx.doi.org/10.1021/ja710438j
- A.E. Aliev, J.R.T. Arendorf, I. Pavlakos, R.B. Moreno, M.J. Porter, H.S. Rzepa, and W.B. Motherwell, "Surfing π Clouds for Noncovalent Interactions: Arenes versus Alkenes", Angewandte Chemie International Edition, vol. 54, pp. 551-555, 2014. http://dx.doi.org/10.1002/anie.201409672
- K. Abersfelder, A.J.P. White, H.S. Rzepa, and D. Scheschkewitz, "A Tricyclic Aromatic Isomer of Hexasilabenzene", Science, vol. 327, pp. 564-566, 2010. http://dx.doi.org/10.1126/science.1181771
Tags: Chemical IT, Country: Svalbard and Jan Mayen, CrossRef, head of information resources, HTML, Imperial College, librarian, online activity, Online Usage, PDF, researcher, search engines, usage statistics portal
Thank you for the blog, 500, very impressive.
This resource: http://chronograph.labs.crossref.org/subdomains/ tracks what are called DOI referrals from a specific domain. A few examples serve to illustrate how active any particular domain might be in requesting a DOI resolution:
http://chronograph.labs.crossref.org/subdomains/ch.ic.ac.uk + http://chronograph.labs.crossref.org/subdomains/ch.imperial.ac.uk together = 5065 (over 5 years).
As usual, much context is required to make any sense of such a statistic. Thus the domain ch.ic.ac.uk was set up in 1993, but since ~2003 the main chemistry departmental web page has been a sub-page of a different domain: http://chronograph.labs.crossref.org/domains/imperial.ac.uk (119493 over 5 years) and statistics cannot be broken down at such a sub-page level. In fact ch.ic.ac.uk continues to host individual group pages, various teaching materials and personal blogs (such as this one), accounting for the activity shown.
Again to insert more context;
http://chronograph.labs.crossref.org/subdomains/www.ch.cam.ac.uk (18588 resolutions) but this now IS the main departmental page. Individual research groups can also own their own domain;
http://chronograph.labs.crossref.org/subdomains/leygroup.ch.cam.ac.uk (2652 resolutions) or
http://chronograph.labs.crossref.org/subdomains/hla.chem.ox.ac.uk (4107 resolutions)
But these two are a bit of a mystery for different reasons (I leave you to find out for yourself):
http://chronograph.labs.crossref.org/subdomains/chemistry.harvard.edu ;
http://chronograph.labs.crossref.org/subdomains/chemistry.mit.edu
I am not yet entirely convinced there is substantial worth in these statistics, but it early days yet!
Tim Gowers is a very influential mathematician, whose blog is widely read and noted. This post; https://gowers.wordpress.com/2016/03/01/discrete-analysis-launched/ has caught attention recently. It notes how one can launch and create a successfull high quality new journal with such a low APC or article processing charge ($10) that this can be absorbed to make the journal free at point of submission. At at time when the traditional publisher (with relatively enormous inherited fixed costs) can (must?) charge anywhere between $800 and $6000 for the APC, any new model is always welcome. I did do a quick check of DOI access statistics, ie http://chronograph.labs.crossref.org/dois/10.19086/da.610 but the Chronograph system does not yet seem to have started collecting data for this new journal. When it does, it will be very interesting to monitor it and compare it with the traditional (and by comparison hugely expensive) journals.
I promised an update on jusp.mimas.ac.uk, which tracks journal usage. Our library have very kindly agreed to issue me with an account. Here is one analysis. Firstly, the way JUSP is organised, you can only track usage at your own institute, not the overall usage globally. I looked at five top chemistry journals, for which one gets a metric called JR1 (= Journal Report 1: Number of Successful Full-Text Article Requests by Journal), the numbers representing total requests for the full year 2015.
ACS JACS: 48471
RSC Chemical science: 4427
RSC Chem Comm: 17913
Angewandte Chemie: 26827
Nature Chemistry: 7622.
These numbers have to be normalised for the number of articles published for each journal in 2015, a total JUSP does not provide. Although I am sure these numbers must be accessible somewhere, I have not yet found an easy way of accessing them. But typically I estimate a top journal publishes between 1000-3000 articles per year. which would give an access rate of ~2-12 per year per article per institute, or possibly 1000 times that on a global stage.
I will continue to explore other statistical possibilities provided by JUSP.