The title of this post paraphrases E. J. Corey’s article in 1997 (DOI: 10.1016/S0040-4039(96)02248-4) which probed the origins of conformation restriction in aldehydes. The proposal was of (then) unusual hydrogen bonding between the O=C-H…F-B groups. Here I explore whether the NCI (non-covalent-interaction) method can be used to cast light on this famous example of how unusual interactions might mediate selectivity in organic reactions.

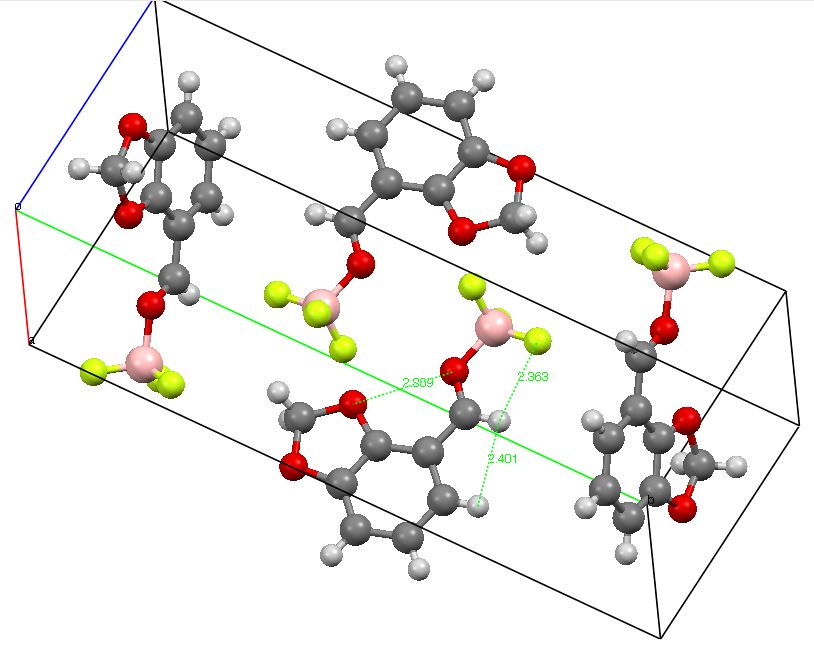
Crystal structure of RUGYEX. Click for 3D
The crystal structure revealed a fixed syn orientation between one B-F bond and the formyl C-H bond, with a distance of ~2.36Å (using un-normalised C-H lengths), compared with a value of 2.55Å for the vdW sum. Since hydrogen bonds to fluorine are quite rare, it seems worth applying the NCI method (
DOI for calculation).

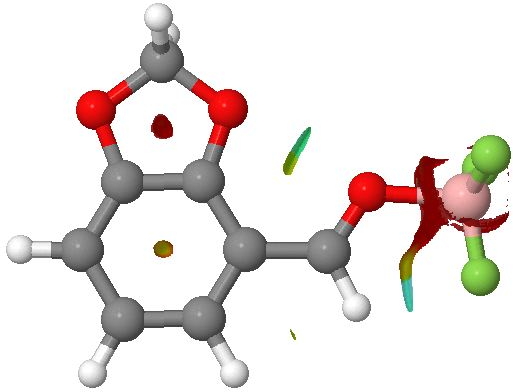
NCI surfaces for RUGYEX. click for 3D.
The result indeed shows a strongly blue (= attractive) interaction surface for the CH…F region, and only a tiny one for the adjacent H…H region. A welcome surprise however is the O…O region, which also shows a distinct (strong) attraction. Perhaps this is due to the presence of the electron withdrawing BF3 group on one of the oxygens. This could also be regarded as a through-space anomeric effect, from one oxygen donating into the O-B σ* orbital. Such
through spaceanomeric effects (they are normally propagated through bonds, as in sugars) are probably more common than we believe.
This result nicely illustrates the utility of the NCI method; it brings an immediate visual impact, which serves to highlight interactions which otherwise might be ignored.
Related
Tags: conformational analysis, Corey, formyl hydrogen, Interesting chemistry, Julia Contreras-Garcia
This entry was posted on Tuesday, May 31st, 2011 at 1:05 pm and is filed under Uncategorised. You can follow any responses to this entry through the RSS 2.0 feed.
You can leave a response, or trackback from your own site.


By the way, QTAIM analysis on the wavefunction file you’ve provided only reveals a bond CP between the oxygen atoms with magnitudes of the electron density and its Laplacian being equal to 0.0096 and 0.040 a.u. respectively. However, looking at the electron density contour map (or its ‘relief map’) I’d say that both O…O and F…H regions look alike and they both resemble a saddle point neighbourhood (unfortunately, I have no clue of how to attach any picture to the post). Starting from the electron density contour map I would doubtlessly assume the existence of the BCP in both regions.
So is it a great advantage of the NCI methdology over the QTAIM that it allows one to discover such weak interactions that do not seem so apparent from the ‘QTAIM viewpoint’? Or maybe it’s just a weakness in the ProAIM algorithm I used within the AIMAll program suite?
QTAIM reveals BCPs in many regions, but one really does need to inspect the density contour maps as well to get a proper valance. NCI does seem to replicate QTAIM but provide a rather better immediate visual balance.
I should point out that you should contact Julia Contreras-Garcia for more explanation; she has certainly investigated these aspects