I am on a mission to persuade my colleagues that the statistical analysis of crystal structures is a useful teaching tool. One colleague asked for a demonstration and suggested exploring the classical Jahn-Teller effect (thanks Milo!). This is a geometrical distortion associated with certain molecular electronic configurations, of which the best example is illustrated by octahedral copper complexes which have a d9 electronic configuration. The eg level shown below is occupied by three electrons and which can therefore distort in one of two ways to eliminate the eg degeneracy by placing the odd electron into either a x2-y2 or a z2 orbital. Here I explore how this effect can be teased out of crystal structures.

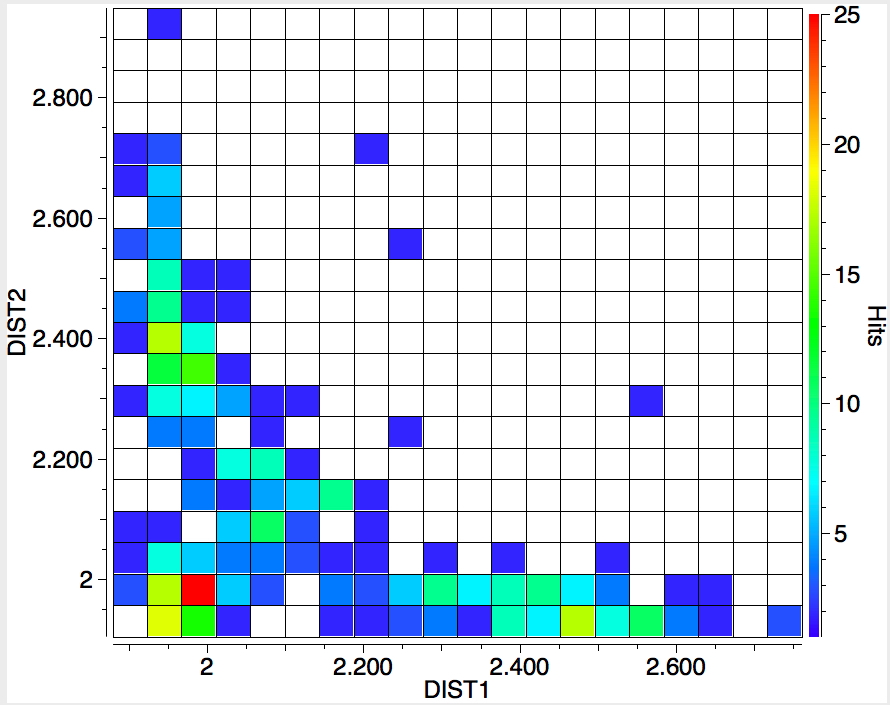
The search is set up with Cu specified as precisely 6-coordinate, and X=oxygen. The six X-Cu distances are defined as DIST1-DIST6. The R-factor is specified as < 0.05 (no disorder, no errors). The problem now is how to plot what is in effect a six-dimensional set of data, from which we are exploring whether four of the distances are different from the other two, and whether those four are the longer or the shorter. This requires analysis beyond the capability (as far as I know) of the Conquest program, and so here I will show sets of plots showing just the relationship between any two distances at a time. Of the 15 possible combinations of two distances, only four are shown below.
Some obvious patterns can already be spotted in the 400 or so compounds which satisfy the search criteria.
- The largest clustering occurs at ~1.95Å, with two clusters each of fewer hits at ~2.5Å. The Wikipedia page notes that for Cu(OH2)6 the Jahn-Teller distortion favours four short bonds at ~1.95Å and two long ones at ~2.38Å, which agrees approximately with the positions and sizes of the centroids of these clusters.†
- Plots 1 and 2 show very little along the diagonals, where the two plotted distances have the same value. This probably means that one of the distances relates to an equatorial ligand and the other to an axial ligand.
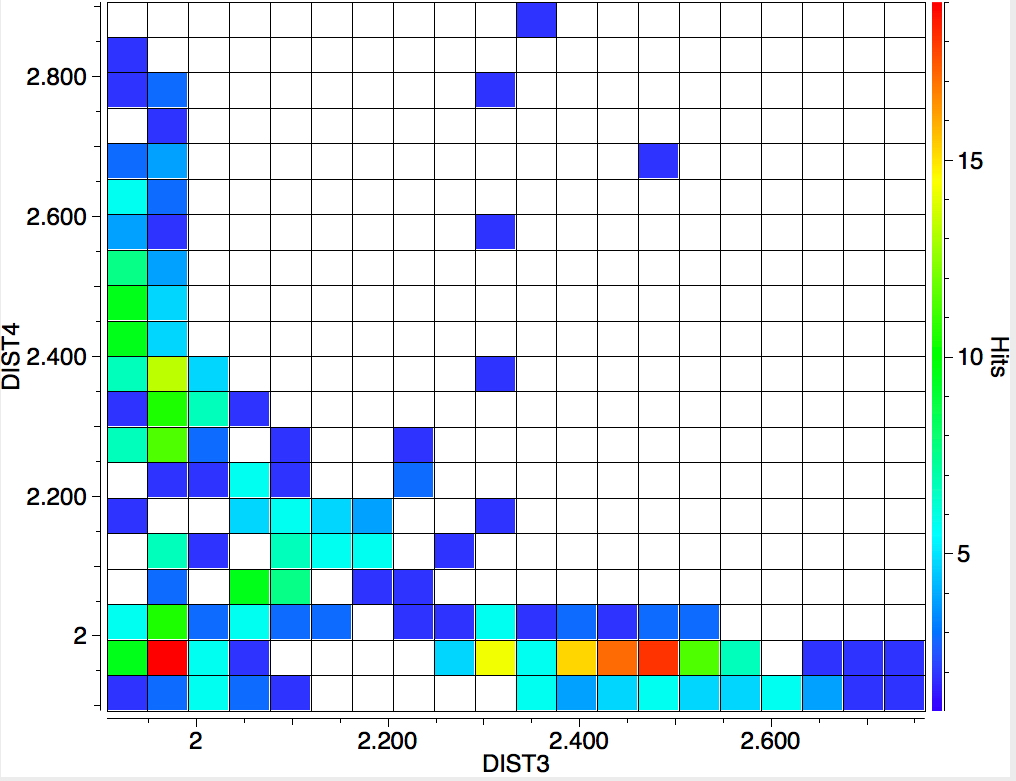
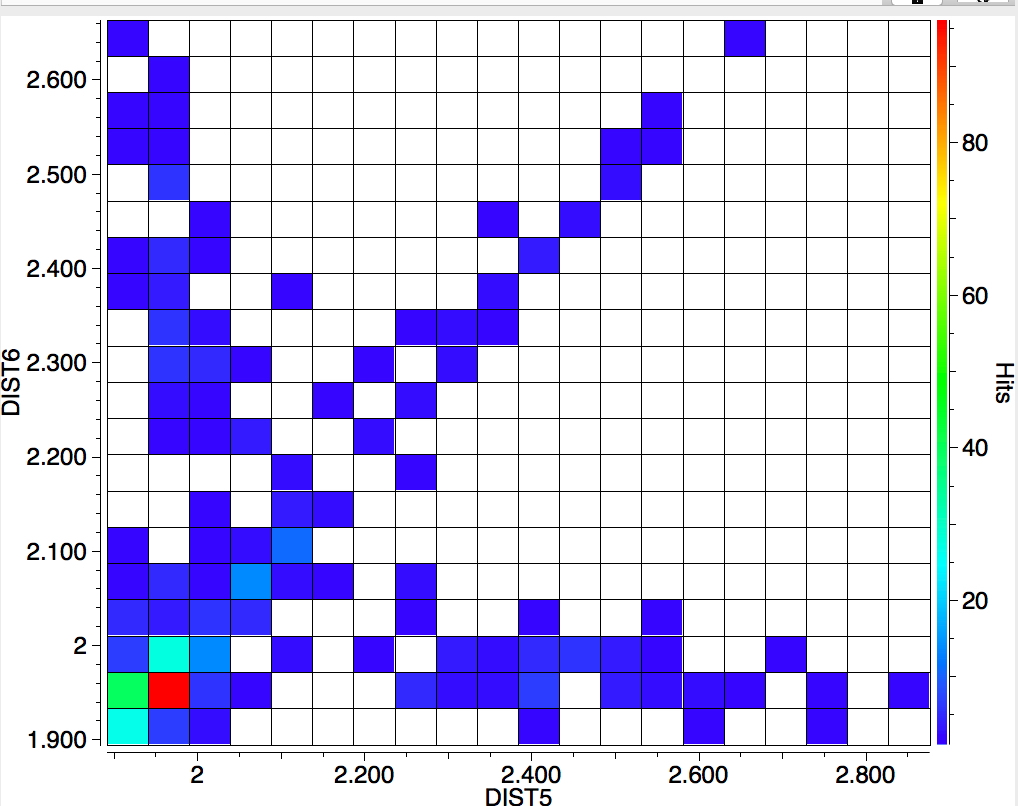
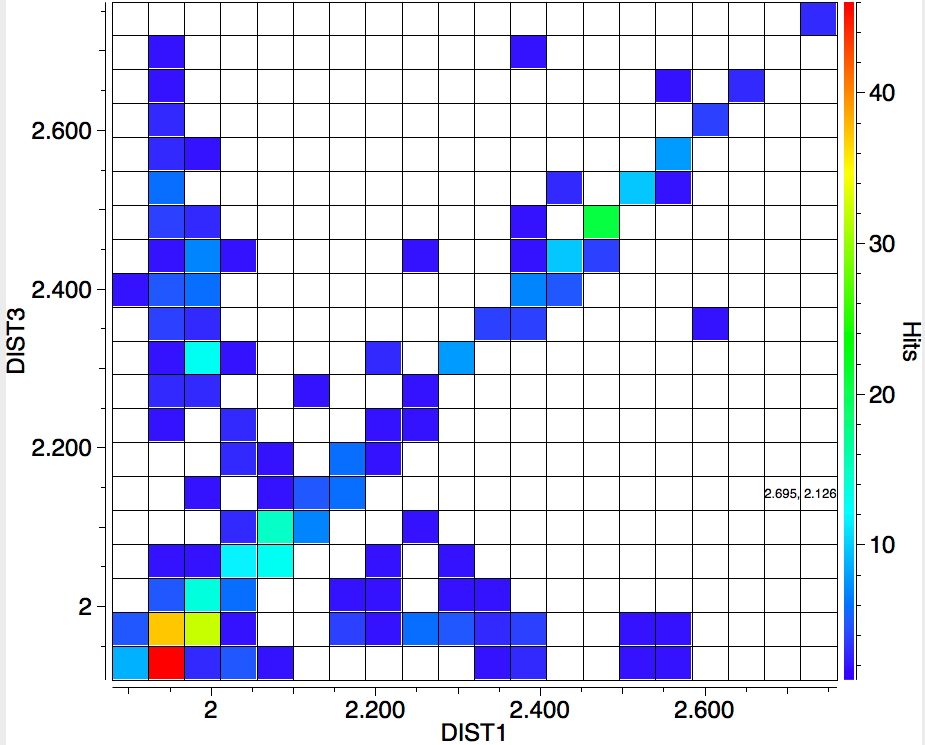
- Plots 3 and 4 show a strong diagonal trend, and so these distances both relate to either axial or equatorial, but not one of each.
- All four plots show a hot spot at ~1.95Å, which hints that the Jahn-Teller distortion is four short bonds/two long.
- Plot 4 also shows a green spot at ~2.5Å which is a tantalising suggestion of examples of four long bonds/two short.‡
Clearly this analysis can be followed up by a visual inspection of individual molecules in each cluster (as well as the outliers which appear to follow no pattern!), together with a more bespoke analysis of the six distances. Unfortunately, the spin state of the complexes cannot be quickly checked (are they all doublets?) since the database does not record these. But the basic search described above takes only a few minutes to do, and it is surprising at how quickly the Jahn-Teller effect can be statistically tested with real experimental data obtained for ~400 molecules. Of course, here I have only explored X=O but this can easily be extended to X=N or X=Cl, to other metals or to alternative coordination numbers such as e.g. 4 where the Jahn-Teller effect can also in principle operate.
‡ One genuine example of this type, also called compressed octahedral coordination, was reported for the species CuFAsF6 and CsCuAlF6[1]
† The measured geometry of Cu(H2O)6 may in fact manifest with six equal Cu-O bond lengths due to the dynamic Jahn-Teller effect, because the kinetic barrier separating one Jahn-Teller distorted form and another (equivalent) isomer is small and hence averaged atom positions are measured which mask the effect. Thus the Jahn-Teller effects shown in the plots above may be under-estimated because of this dynamic masking. Reducing the temperature of the sample at which data was collected would reduce this dynamic effect. Indeed, Cu(D2O)6 collected at 93K shows a very clear Jahn-Teller distortion[2] with four short bonds ranging from 1.97-1.99Å and two long bonds 2.37-2.39Å.[3] Another example measured at 89K with dimethyl formamide replacing water and coordinated via oxygen[4] shows four short (1.97-1.98Å) and two long (2.315Å) bonds. This latter example is also noteworthy because this analysis is as yet unpublished in a journal, but the data itself has a DOI via which it can be acquired. A nice example of modern research data management!
References
- Z. Mazej, I. Arčon, P. Benkič, A. Kodre, and A. Tressaud, "Compressed Octahedral Coordination in Chain Compounds Containing Divalent Copper: Structure and Magnetic Properties of CuFAsF6 and CsCuAlF6", Chemistry – A European Journal, vol. 10, pp. 5052-5058, 2004. http://dx.doi.org/10.1002/chem.200400397
- W. Zhang, L. Chen, R. Xiong, T. Nakamura, and S.D. Huang, "New Ferroelectrics Based on Divalent Metal Ion Alum", Journal of the American Chemical Society, vol. 131, pp. 12544-12545, 2009. http://dx.doi.org/10.1021/ja905399x
- Zhang, Wen., Chen, Li-Zhuang., Xiong, Ren-Gen., Nakamura, T.., and Huang, S.D.., "CCDC 755150: Experimental Crystal Structure Determination", 2010. http://dx.doi.org/10.5517/CCTBSPL
- Olmstead, Marilyn M.., Marlin, Dana S.., and Mascharak, P. K.., "CCDC 1053817: Experimental Crystal Structure Determination", 2015. http://dx.doi.org/10.5517/CC14CL36
Tags: basic search, Chemical bond, chemical bonding, Chemical IT, Chemistry, classical Jahn-Teller, clear Jahn-Teller, Coordination chemistry, Coordination complex, Copper(II) nitrate, dynamic Jahn-Teller, Edward Teller, Inorganic chemistry, Jahn-Teller, Jahn–Teller effect, Metal ions in aqueous solution, search criteria, Technology/Internet, Transition metals
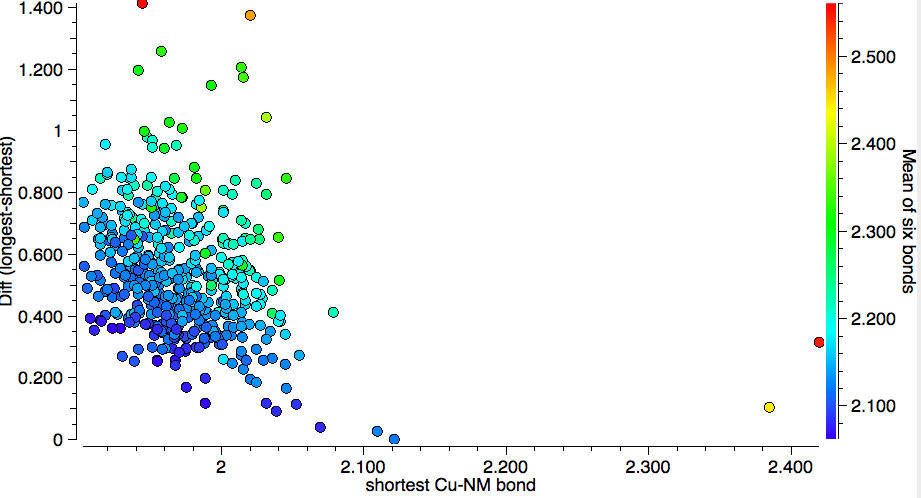
Revisiting this search, I present the data in a different form. The search query measures the six Cu-NM lengths in 6-cordinate Cu. For each structure, the mean of the six bond lengths, the shortest bond and the difference between the shortest and longest are calculated. The results are presented below, with the x-axis representing the shortest bond, the y-axis the difference and the colour code the mean length for each structure.
1. The cyan coloured dots represent structures with short mean bond lengths and relatively small Jahn-Teller distortions (the difference between the shortest and longest bonds).
2. There is a significant cluster for which only a small difference is recorded (circled in red). These are probably the ones exhibiting the dynamic Jahn-Teller effect, where the barrier to transpose a long and a short bond is small and so the average is recorded.
3. The green dots represent systems with short bonds but much larger Jahn-Teller differences.
4. The yellow dots represent the longest bonds, but not necessarily with larger JT differences.
When the temperature of data collection is restricted to < 100K, the region circled in red above largely vanishes; the dynamic Jahn-Teller is suppressed.